Abstract
Context: Hyperprolactinemia has been associated with adverse metabolic effects, and treatment of prolactinoma is directed at lowering prolactin levels; however, little is known about the effects of hypoprolactinemia.
Objective: This systematic review and meta-analysis aimed to investigate the metabolic effects of prolactin-lowering therapy in prolactinoma.
Methods: PubMed was searched through November 25, 2024. Mixed-effect meta-regression models were employed to assess for an association between prolactin and selected metabolic measures of body mass index (BMI), low-density lipoprotein (LDL) cholesterol, and homeostatic model assessment for insulin resistance (HOMA-IR).
Results: A total of 16 studies involving 440 patients (257 women, 183 men) were included. When assessing change with prolactinoma treatment, there was no statistically significant association between change in prolactin levels and change in BMI, LDL, or HOMA-IR. When divided into two groups by post-treatment prolactin levels, the low prolactin group (≤15 mcg/L) trended towards lower BMI (−1.44, 95% CI −4.29–1.41, p = 0.32), lower LDL (−11.02, 95% CI −27.76–5.72, p = 0.20), and lower HOMA-IR (−0.64, 95% CI −2.16–0.87, p = 0.40); however, none of these associations were statistically significant.
Conclusion: Our meta-analysis did not demonstrate a statistically significant association between prolactin and the metabolic risk measures selected in our study. These findings suggest that suppressing prolactin levels to below 15 mcg/L may not have as significant a metabolic impact as previously believed; however, there was limited assessment of very suppressed prolactin levels due to data availability. Further investigation of the metabolic effects of hypoprolactinemia is warranted.
Keywords
prolactin, prolactinoma, metabolism, body mass index, low-density lipoprotein, HOMA-IR
Abbreviations
BMI: body mass index; LDL: low-density lipoprotein; HOMA-IR: homeostatic model assessment for insulin resistance; SD: standard deviation; IQR: interquartile range; HDL: high-density lipoprotein; CI: confidence interval
Background
Prolactin is a hormone primarily produced by pituitary lactotrophs, and hypothalamic dopamine acts as its primary regulator [1, 2]. The primary effect of prolactin is to stimulate lactogenesis; however, there is a growing body of evidence to suggest that prolactin expression plays an integral role in metabolic health [3, 4] (Figure 1). In the pancreas, prolactin modulates the growth of beta cells, which are responsible for the synthesis, storage, and release of insulin [4, 5]. In the liver, prolactin prevents hepatic steatosis by decreasing triglyceride accumulation and improves hepatic insulin sensitivity [6, 7]. In adipose tissue, prolactin promotes insulin sensitivity while preventing adipocyte hypertrophy and inhibits lipoprotein lipase [1, 8]. Given the role of prolactin in key metabolic tissues, it has been suggested that adequate prolactin levels are needed to promote and maintain metabolic homeostasis [3, 4].
 Figure 1: Suggested mechanisms of the metabolic effects of prolactin.
It is well-studied that hyperprolactinemia is correlated with metabolic alterations, including obesity, insulin resistance, and dyslipidemia [9–13]. Additionally, several studies have demonstrated that the use of dopamine agonists in patients with prolactinoma is associated with improved anthropometric and metabolic measures [14–17]. In contrast, emerging data suggest that over-suppression of prolactin with dopamine agonists may be associated with visceral adipocyte hypertrophy, increased insulin resistance, increased body mass index (BMI), and other metabolic disturbances, as well as depression and sexual dysfunction [18–22]. In one study, low prolactin, defined as < 12 mcg/L, was associated with increased fasting insulin level, increased homeostatic model assessment for insulin resistance (HOMA-IR), and increased visceral adipocyte hypertrophy [18]. In a study of pre- and post-menopausal women experiencing sexual dysfunction, low prolactin, defined as < 9.83 mcg/L, was associated with increased BMI and waist circumference [19].
Given evidence that both suppressed and elevated prolactin may be associated with unfavorable metabolic outcomes, it has been suggested that there may be a “Goldilocks zone” for serum prolactin that promotes metabolic homeostasis [3, 23]. A recent review article called for classification of prolactin levels by quartiles according to their impact on metabolic health, such that prolactin < 7 mcg/L may be considered metabolically detrimental, prolactin 7–15 mcg/L may be considered a “maintenance” mode of metabolism, prolactin 15–25 mcg/L may be considered metabolically beneficial, and, in the absence of a pathologic cause of hyperprolactinemia, prolactin 25–100 mcg/L may represent a physiologic response to increased metabolic need [3, 24].
Historically, treatment of hyperprolactinemia was directed at lowering prolactin levels to low or even undetectable levels, with an incomplete understanding of the optimal target level. Given the heterogeneity of patients with hyperprolactinemia, we chose to focus on patients with prolactinoma as it is the most common pathologic etiology of hyperprolactinemia [25, 26]. This review aims to elucidate the metabolic effects of hypoprolactinemia among patients with prolactinoma who underwent medical, surgical, or radiation therapy.
Methods
We performed a systematic review of observational and interventional studies assessing patients who underwent the use of dopamine agonists, surgery, or radiotherapy to treat prolactinomas according to the PRISMA network meta-analysis guidelines (Figure 2).
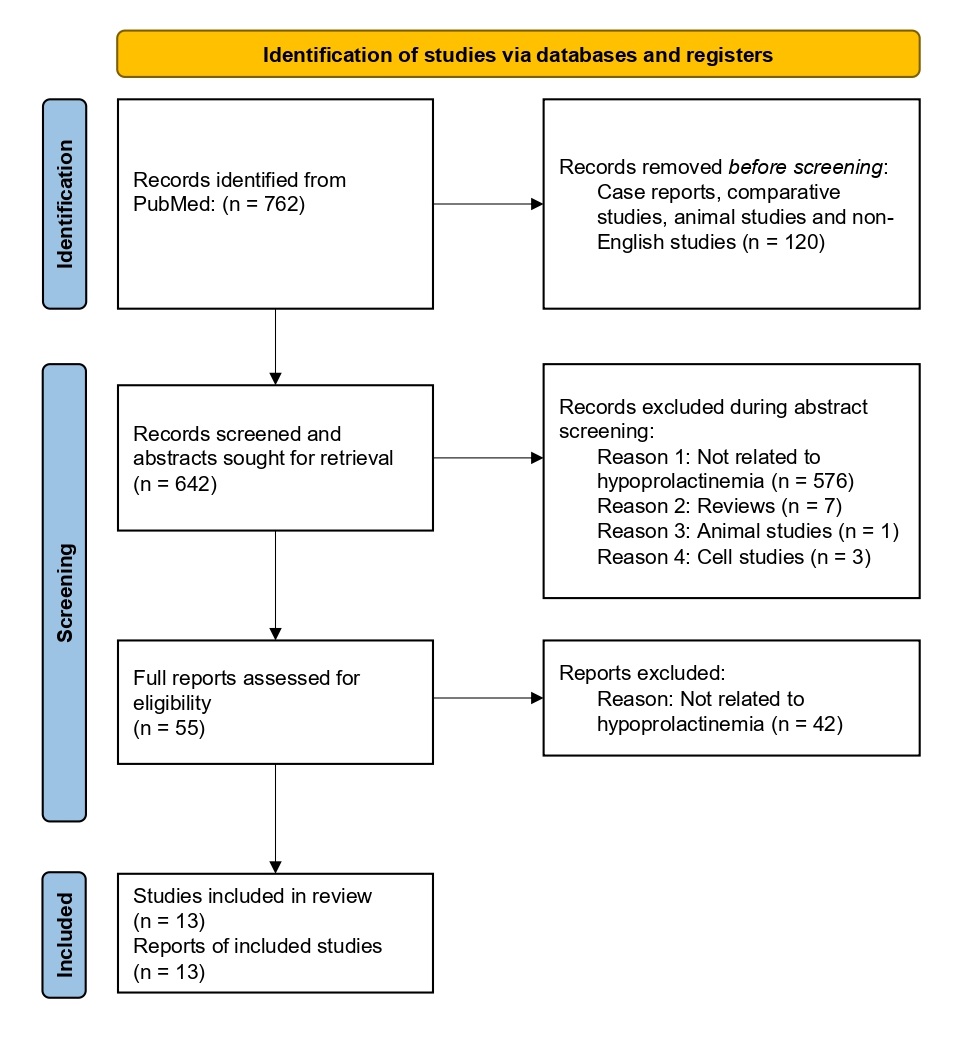 Figure 2: PRISMA flow diagram demonstrating the flow of study identification, screening, and inclusion. The original PubMed search resulted in 762 records. Prior to abstract screening, 120 records were removed because they were identified as case reports, comparative studies, animal studies, or non-English studies. This left 642 records to enter abstract screening, during which 587 records were excluded for the following reasons: 576 were not related to hypoprolactinemia, 7 were reviews, 1 was an animal study, and 3 were cell studies. The remaining 55 records were assessed for eligibility by screening full-text articles, during which 42 reports were excluded because they were not related to hypoprolactinemia, leaving 13 studies included in our analysis.
Article search strategy
We conducted a literature search for studies published on or before November 25, 2024, on PubMed. Search terms encompassed relevant keywords, such as “metabolism,” “prolactin,” “pituitary neoplasm,” “dopamine agonist,” “pituitary surgery,” and “radiation therapy,” supplemented with MeSH terms and combined by using Boolean operators “AND” and “OR”. Filters for case reports, reviews, and animal models were also included in the search terms to remove them from the query results. Search results were uploaded into Covidence to facilitate article review.
Inclusion/exclusion criteria
To identify studies eligible for inclusion, the following criteria were used: 1) Observational (cross-sectional, case-control, and cohort) or interventional (randomized controlled trial) studies assessing the use of dopamine agonists, surgery, or radiotherapy to treat prolactinoma; 2) Papers written in or translated into the English language; and 3) Papers published in a peer-reviewed journal. Case reports, reviews, and animal studies were excluded from the review.
Article screening
Using Covidence, three authors screened the abstracts of the extracted articles based on the inclusion and exclusion criteria stated above and reviewed the full manuscripts of those abstracts deemed to fit the inclusion criteria and none of the exclusion criteria. Further exclusions were made upon full manuscript evaluation. Once the final set of studies was determined, study design, population, participant characteristics, medical intervention, and outcomes were extracted.
Quality assessment
Each study included in this review was evaluated by two reviewers to ensure it met study inclusion criteria and to confirm accuracy in data entry. During the full-text review, studies were assessed using the Cochrane Bias Assessment to determine the risk of bias in various domains, including selection, performance, detection, attrition, and reporting bias. In each applicable domain, risk-of-bias evaluations were determined as low risk, some concerns, or high risk of bias. Two reviewers were involved in the quality assessment. To avoid potential bias upon analysis, data extrapolation and data analysis were done by separate researchers with blinding.
Data collection
The following measures, if available, were extracted from each article included in the meta-analysis: sample size per cohort, gender distribution, date of follow-up after treatment, pre- and post-treatment levels of prolactin, low-density lipoprotein (LDL), BMI, and HOMA-IR, which were typically presented as mean or median with corresponding standard deviation (SD) or interquartile range (IQR). These metabolic parameters were selected based on data availability. As needed, prolactin values were converted from mIU/L to mcg/L by dividing by 21.2 based on the WHO’s Third International Standard for prolactin, IS 84/500 [27]. Median and IQR values were converted into mean and SD values using the Meta-Analysis Accelerator conversion tool [28].
Statistical analysis
If an article provided data separated into study arms, each arm was treated as a separate study. For studies that reported data from multiple post-treatment follow-up visits, the post-treatment data points were collected for the visit closest to 6 months post-treatment. Mixed-effect meta-regression models were employed to assess the impact of pre-treatment and post-treatment prolactin on pre-treatment and post-treatment BMI, LDL, and HOMA-IR, respectively, and to evaluate the impact of change in prolactin on the change in BMI, LDL, and HOMA-IR.
The second analysis conducted compared studies by the degree to which prolactin was suppressed. Using the median post-treatment prolactin (15.25 mcg/L) to establish a cutoff value of 15 mcg/L, two subgroups were constructed: low post-treatment prolactin and high post-treatment prolactin. Forest plots were constructed for each metabolic parameter (BMI, LDL, and HOMA-IR) by subgroup. A mixed effect meta-regression model was conducted to determine if the level to which prolactin was lowered significantly impacted the metabolic parameters of interest.
Results
Characteristics of included studies
A PubMed literature search for articles with keywords published on or before November 25, 2024 resulted in 762 peer-reviewed articles. 120 articles were removed before screening because they were case reports, comparative studies, animal studies, or non-English studies. Of the remaining 642 research articles, 587 were manually excluded from this systematic review during abstract screening. Major reasons for exclusion included, but were not limited to, lack of key data on metabolic parameters or prolactin levels, animal studies or reviews, and cell studies. Upon assessment of the full papers, an additional 42 studies were excluded as they were not related to hypoprolactinemia. Thus, 13 articles met the inclusion criteria and were included in this systematic review. Of these, three reported their results by study arm, and as previously decided, each study arm was treated as a separate study, resulting in a final total of 16 studies. The table outlines the characteristics of the peer-reviewed research included in our analysis (Table 1). The figure displays funnel plots comparing the precision and results of individual studies; given that all three are relatively symmetrical, there is no evidence of publication bias (Figure 3).
 Figure 3: Funnel plots of the studies included in the meta-analysis. These compare the precision and results of individual studies. Given that all three are relatively symmetrical, there is no evidence of publication bias. BMI: body mass index; HOMA-IR: homeostatic model assessment for insulin resistance; LDL: low-density lipoprotein.
Mixed-effect meta-regression analysis
The range of pre-treatment prolactin was 43 mcg/L to 3,254.3 mcg/L. Our analysis showed that at baseline, there was no significance in the relationship between pre-treatment prolactin and pre-treatment BMI (0.0001, CI: -0.0013–0.0015, p-value: 0.89), between pre-treatment prolactin and pre-treatment LDL (0.0017, CI: -0.0082–0.0117, p-value: 0.73), or between pre-treatment prolactin and pre-treatment HOMA-IR (-2.2879×10⁻⁵, CI: -00014–0.0014, p-value: 0.97).
The range of post-treatment prolactin was 8.4 mcg/L to 166.4 mcg/L. Our analysis also demonstrated no significance in the relationship between post-treatment prolactin and post-treatment BMI (0.0555, CI: -0.1110–0.2219, p-value: 0.51), between post-treatment prolactin and post-treatment LDL (0.0508, CI: -0.1793–0.2810, p-value: 0.67), or between post-treatment prolactin and post-treatment HOMA-IR (0.0133, CI: -0.0052–0.0318, p-value: 0.16).
Mixed-effect meta-regression models were then employed to assess the impact of treatment. Our analysis found that decreasing prolactin by 1 mcg/L is associated with, on average, a BMI reduction of 0.0005 kg/m2 (CI: -0.0009–0.0018, p-value: 0.50), a LDL increase of 0.0052 mg/dL (CI: -0.0132–0.0029, p-value: 0.21), and a HOMA-IR reduction of 0.0001 (CI: -0.0008–0.0011, p-value: 0.78) (Figure 4). All associations were not significant. Thus, in patients who underwent prolactinoma treatment, a change in prolactin was not significantly associated with a change in BMI, LDL, or HOMA-IR.
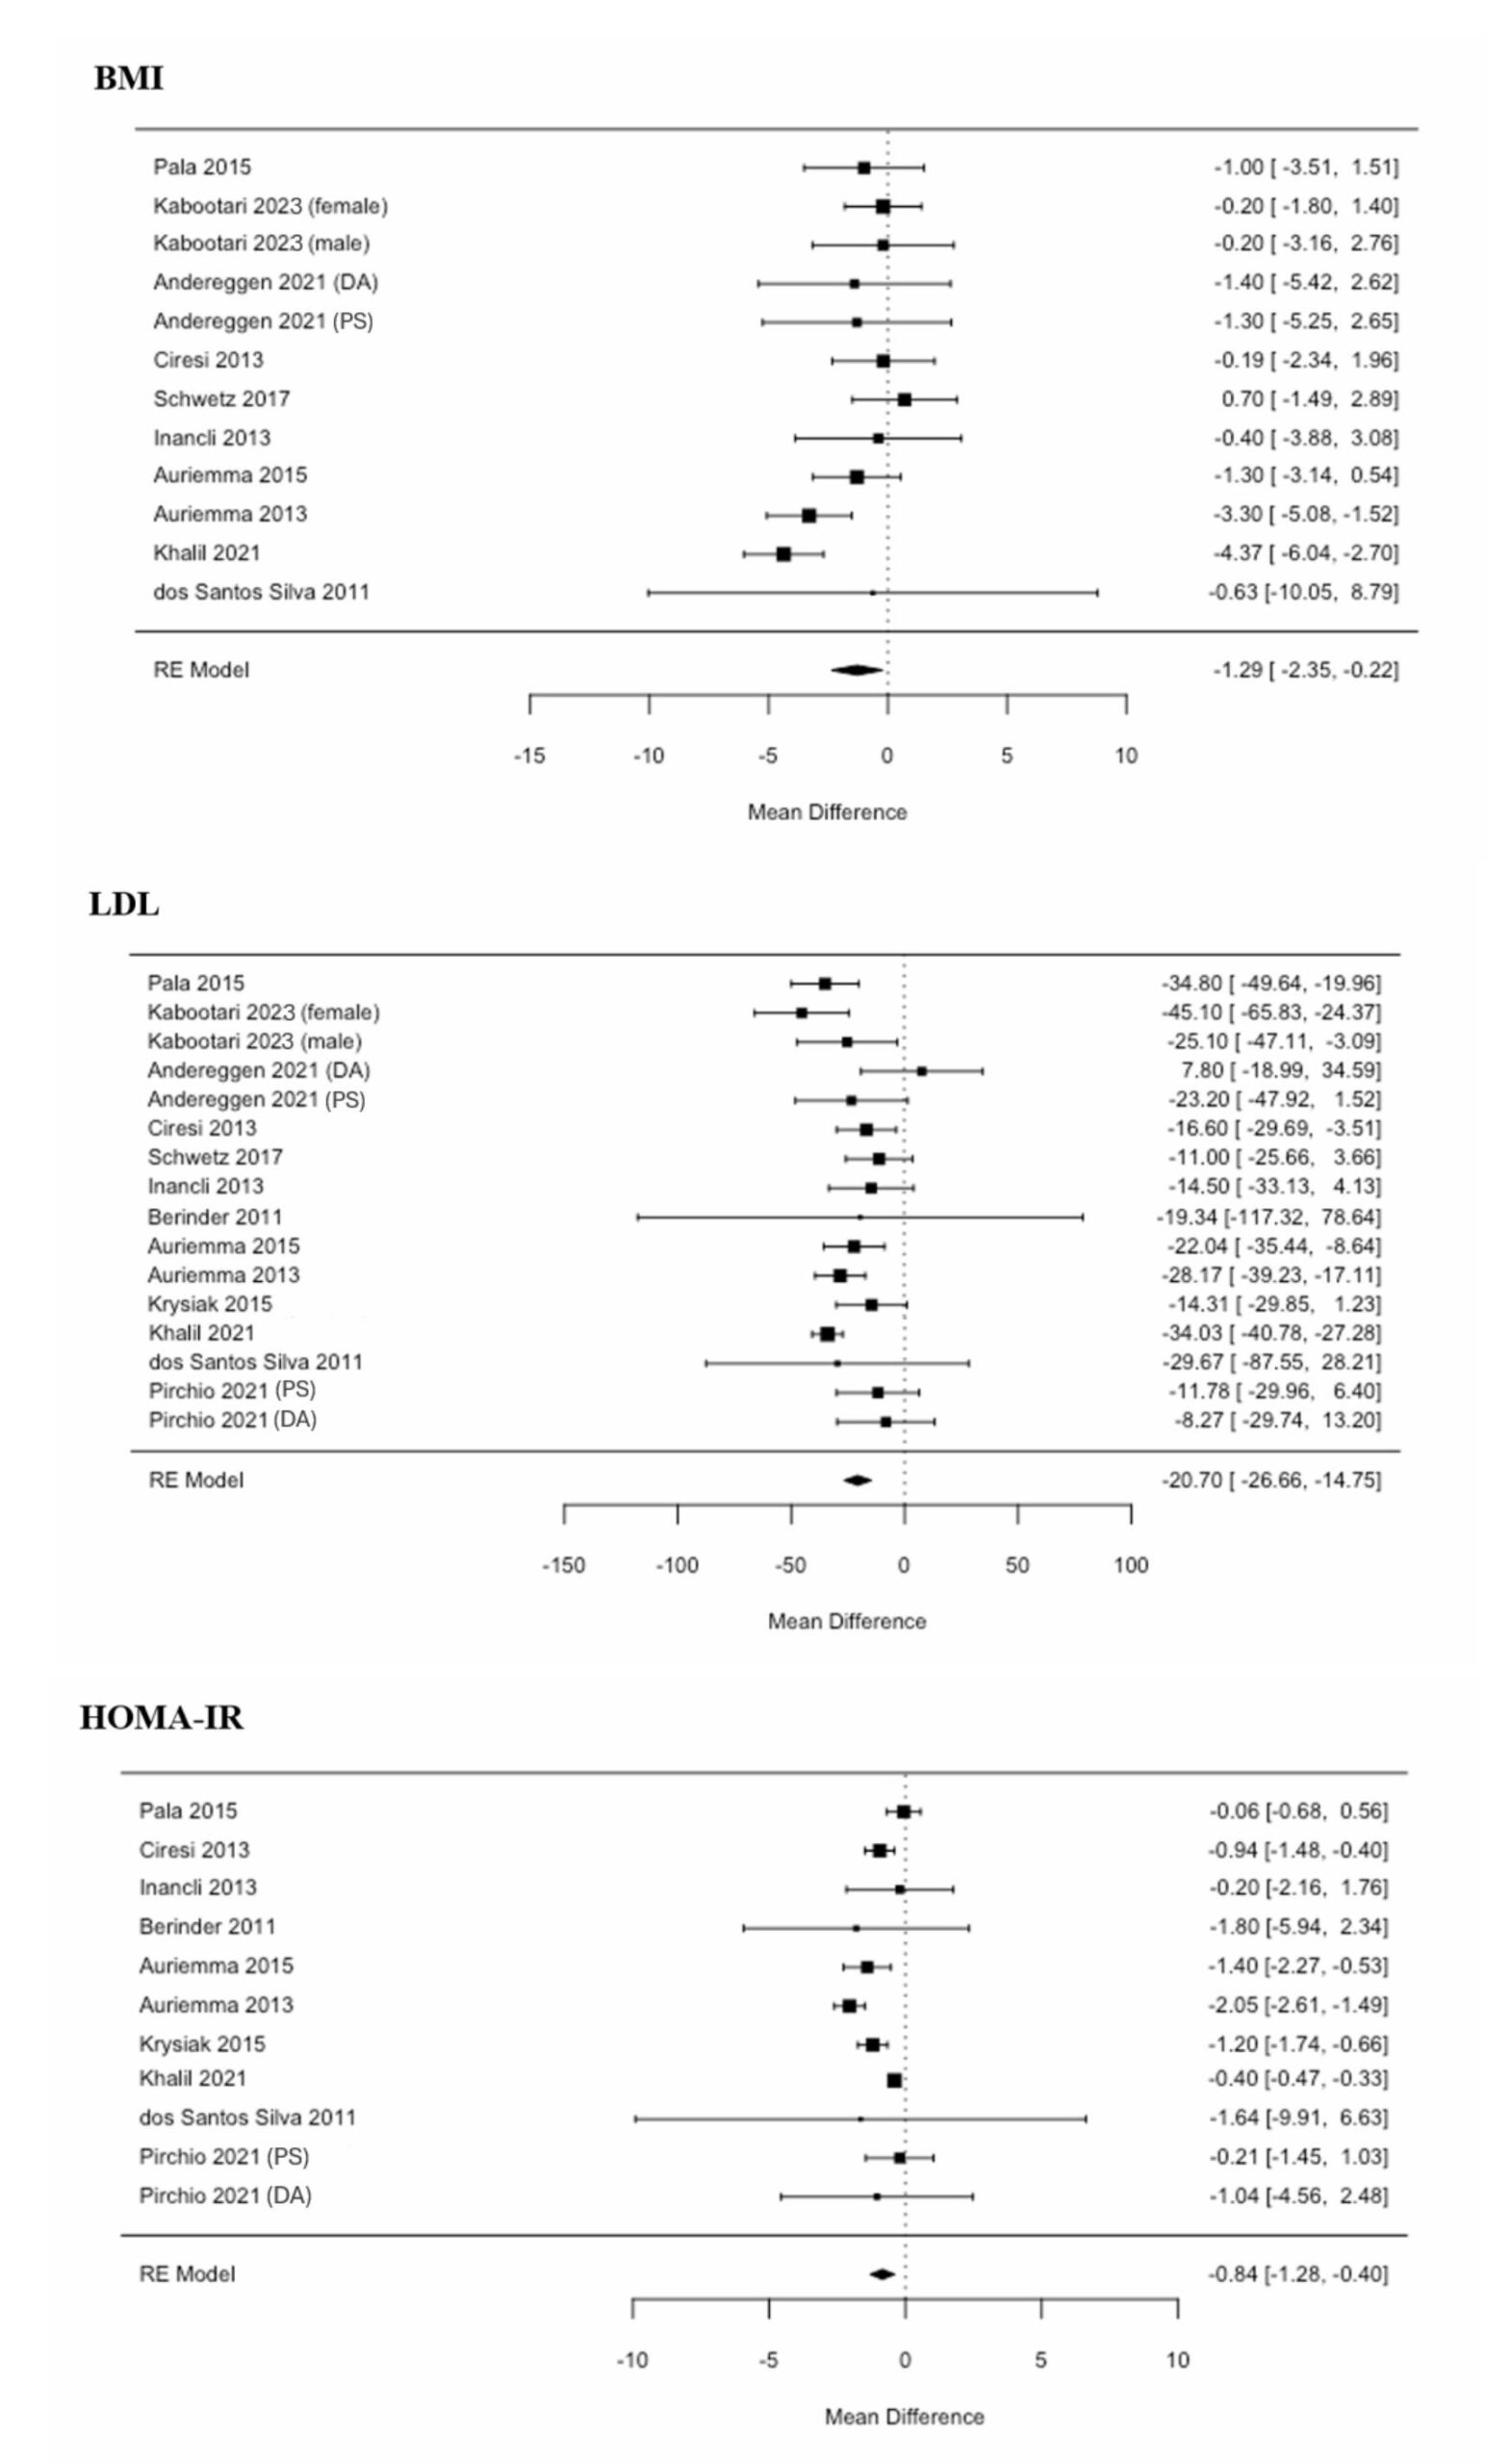 Figure 4. Forest plots of the mean differences before and after treatment. Mixed-effect meta-regression models were employed to assess the impact of treatment. None of these associations were statistically significant. Thus, in patients who underwent prolactinoma treatment, a change in prolactin was not significantly associated with a change in BMI, LDL, or HOMA-IR. BMI: body mass index; DA: dopamine agonist; F: female; HOMA-IR: homeostatic model assessment for insulin resistance; LDL: low-density lipoprotein; M: male; PS: pituitary surgery; RE: random effects.
Degree of prolactin suppression analysis
As previously described, the studies were divided into two subgroups: high and low post-treatment prolactin, with a threshold of 15 mcg/L. Data points included in each metabolic sub-analysis were dependent on the availability of the reported data.
Of the 12 studies that reported BMI, post-treatment BMI in the low prolactin subgroup was estimated to be 1.44 ± 1.45 kg/m2 (p-value 0.32) lower than that of the high prolactin subgroup (Figure 5). Of the 16 studies that reported LDL, post-treatment LDL in the low prolactin subgroup was estimated to be 11.02 ± 8.54 mg/dL (p-value 0.2) lower than that of the high prolactin subgroup (Figure 5). Of the 11 studies that reported HOMA-IR, post-treatment HOMA-IR in the low prolactin subgroup was estimated to be 0.64 ± 0.77 (p-value 0.4) lower than that of the high prolactin subgroup (Figure 5). Notably, none of these associations were statistically significant.
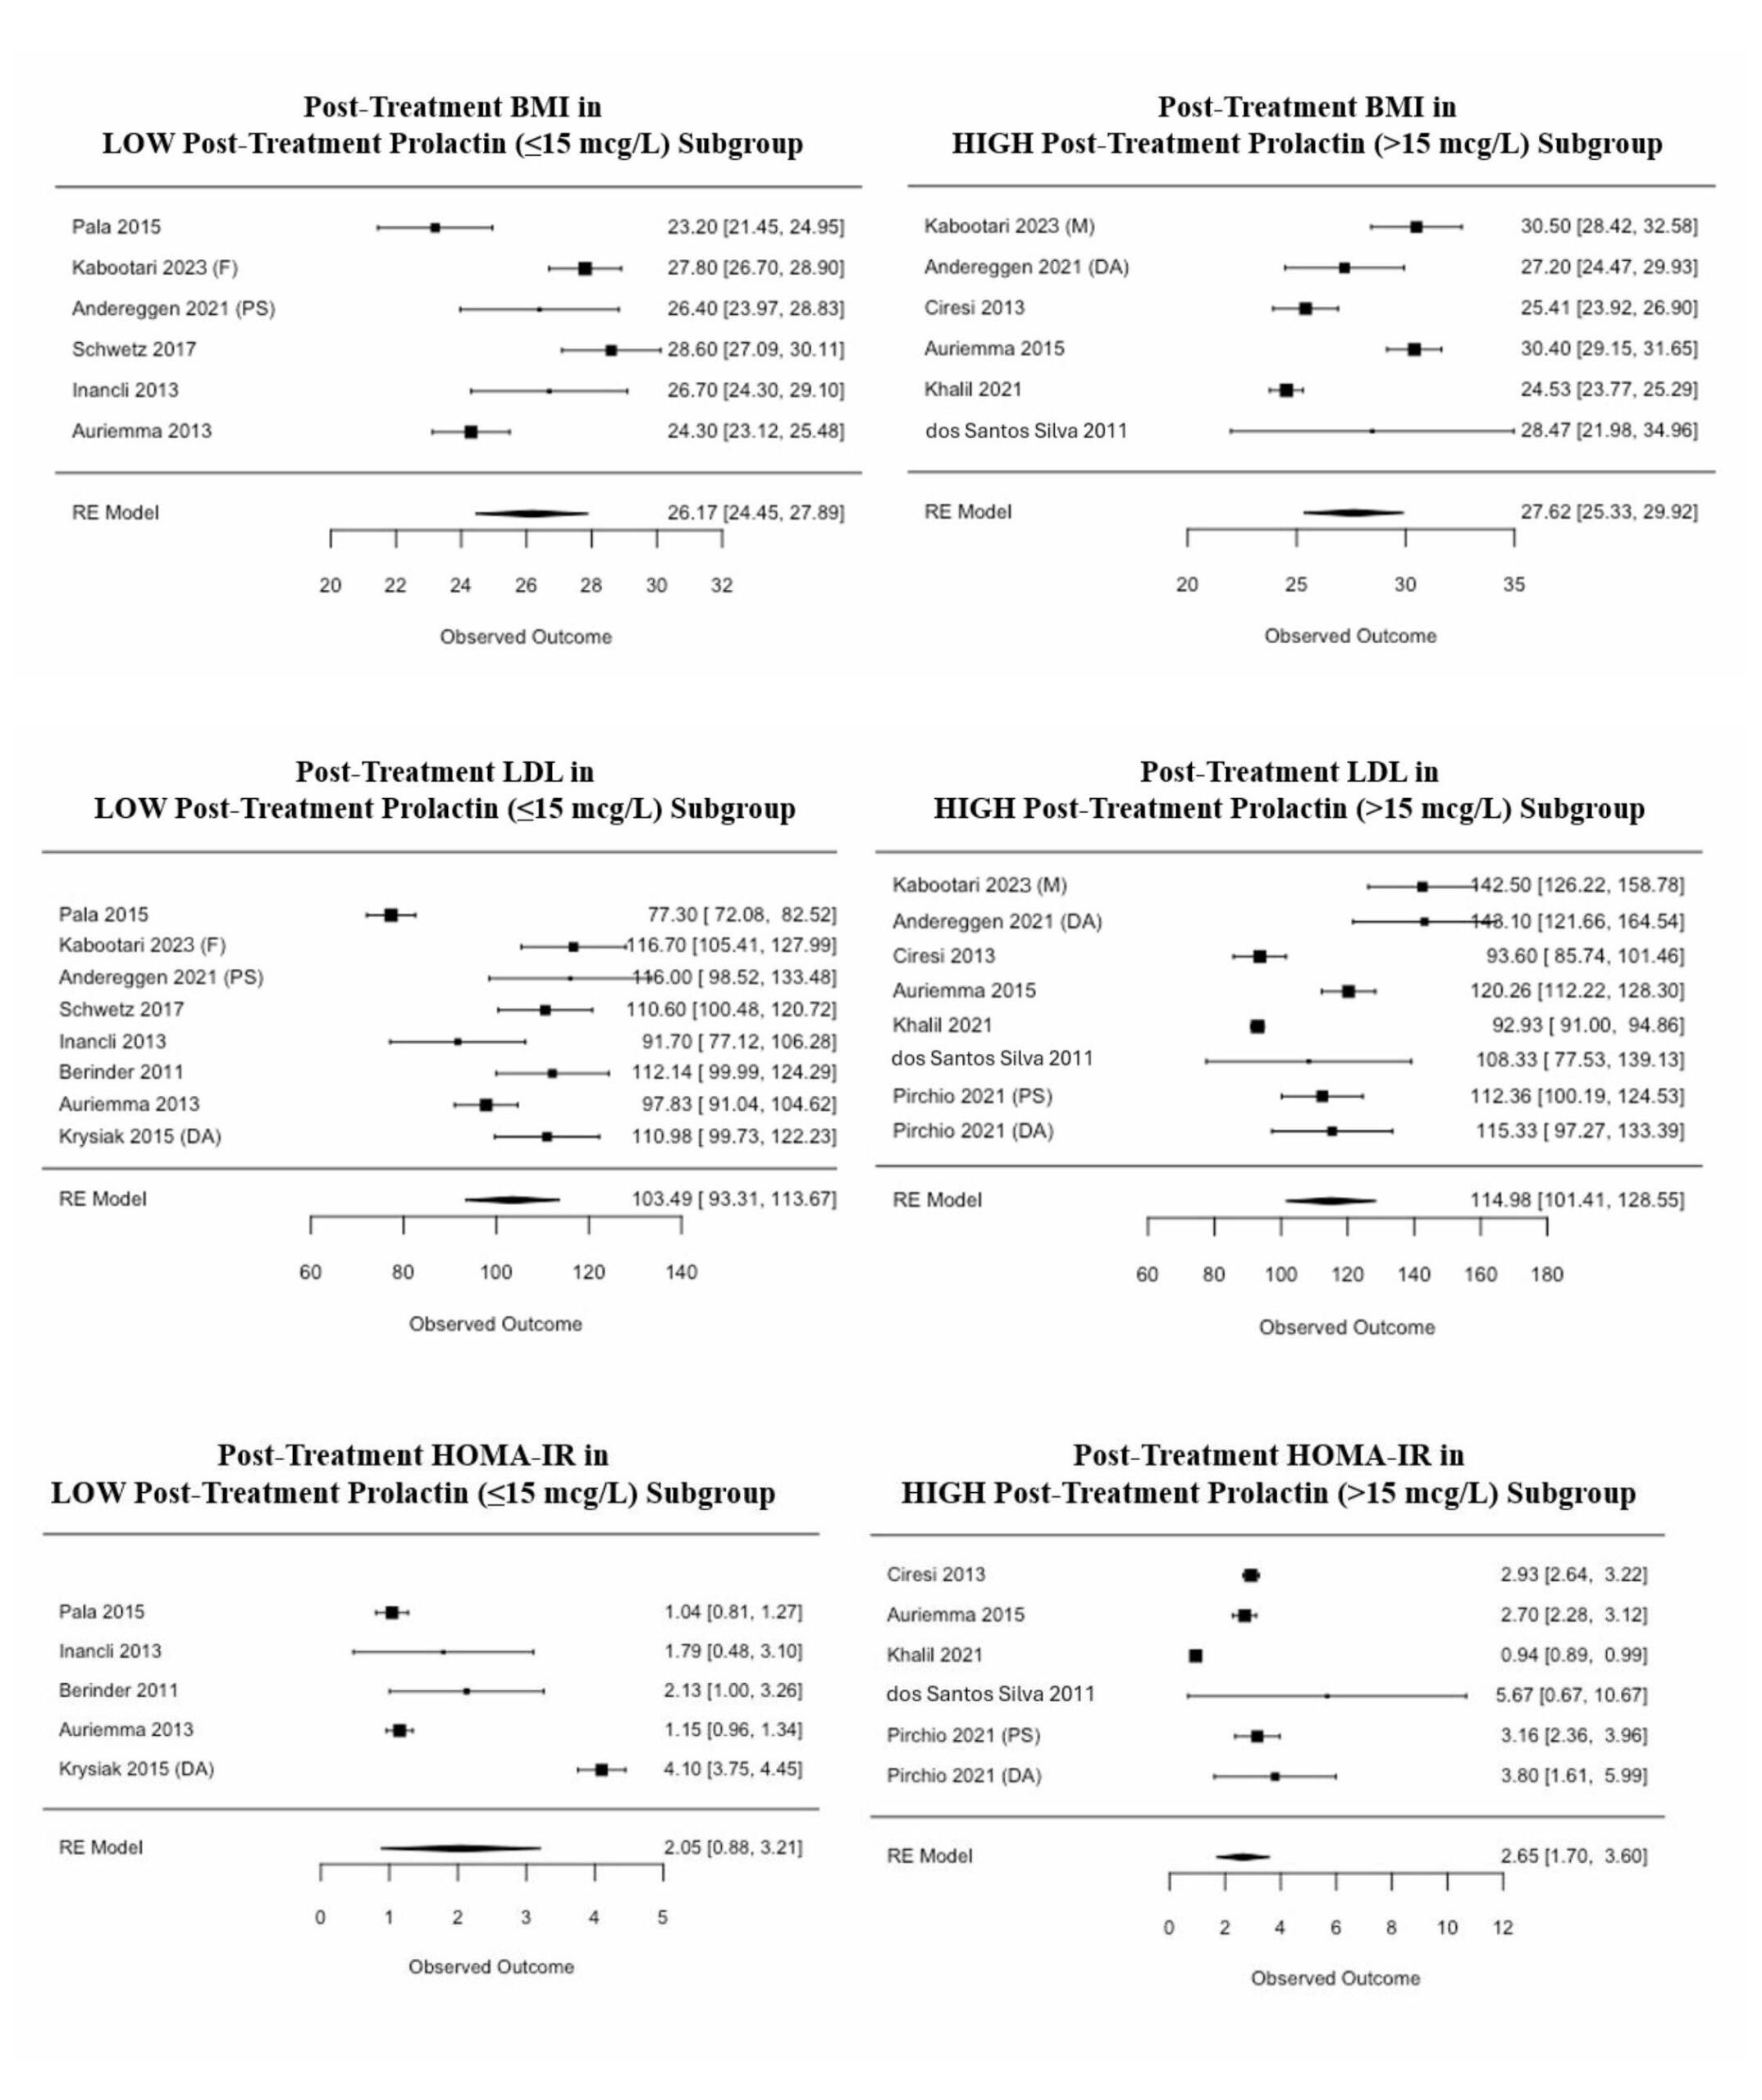 Figure 5: Forest plots of the degree of prolactin suppression. The included studies were divided into two subgroups: high and low post-treatment prolactin, with a threshold of 15 mcg/L. Mixed-effect meta-regression models were employed to determine if the level to which prolactin was lowered significantly impacted BMI, LDL, or HOMA-IR. None of these associations were statistically significant. BMI: body mass index; DA: dopamine agonist; F: female; HOMA-IR: homeostatic model assessment for insulin resistance; LDL: low-density lipoprotein; M: male; PS: pituitary surgery; RE: random effects.
Discussion
Our meta-analysis did not demonstrate a statistically significant association between prolactin levels and the metabolic risk measures selected in this study. However, when dividing the post-treatment data into two groups, we observed that the low prolactin group (< 15 mcg/L) trended towards lower BMI, LDL, and HOMA-IR, although none of these associations were statistically significant. These findings were contrary to our original hypothesis, given a growing body of evidence that both suppressed and elevated prolactin may be associated with unfavorable metabolic outcomes. Rather than concluding that no such association exists, we argue instead that more research is needed in this area.
There were several limitations to our study, particularly in the area of data availability. Most notably, our study was unable to assess very suppressed prolactin levels, because none of our included studies had a mean post-treatment prolactin level below 8.4 mcg/L. Across our included studies, the mean post-treatment prolactin levels ranged from 8.4 to 166.4 mcg/L, with a median of 15.25 mcg/L; this was our reasoning for establishing a cutoff for “low” prolactin as < 15 mcg/L. Existing studies hypothesize an association with unfavorable metabolic outcomes at both suppressed prolactin levels, defined in various non-prolactinoma studies as below 5, 7, 9, or 12 mcg/L [3, 18–20, 29, 30], and elevated prolactin levels; such an association would be a non-linear, inverted U-shaped curve. While we concluded that there is no significant linear association between prolactin and the metabolic risk measures selected in this study, we were unable to assess for the presence of an inverted U-shaped association given the lack of data on very suppressed prolactin levels. In addition, no randomized controlled trials were identified in our literature search and included in our study; therefore, all the included studies were observational studies, which generally have a higher risk of bias and confounding. When further critiquing the quality of the data provided by these observational studies, it is important to note that several studies had very wide confidence intervals, as visually demonstrated by the forest plots (Figures 4 and 5), which likely impacted our final analysis as we weighted all included studies equally and did not discard any outliers. Another study limitation related to data availability is that, despite our inclusion criteria, none of our included studies assessed patients treated with radiation therapy; all patients were treated with dopamine agonists or pituitary surgery. Furthermore, only two of our included studies examined pituitary surgery, and thus, the majority of our data is representative of dopamine agonists due to data availability. Other study limitations include our assessment of only three metabolic parameters, BMI, LDL, and HOMA-IR, with the acknowledgement that other parameters, such as fasting glucose, insulin, high-density lipoprotein (HDL), triglycerides, and waist circumference, may be relevant. This was because the studies ultimately included in our analysis did not include these other data in as much detail, and thus, we were unable to perform any analysis on them.
The mechanism by which prolactin is normalized or suppressed may influence its effect on metabolic parameters. The literature suggests that dopamine agonists may have intrinsic properties that impact metabolic measures independent of their prolactin-lowering effects. Some hypotheses include that dopamine agonists may alter glucose metabolism by fortifying the suppression of endogenous glucose, by enhancing splanchnic glucose uptake, or through hypothalamic effects [31, 32]. Of note, bromocriptine is an FDA-approved medication for type 2 diabetes, and in phase II and III clinical trials was found to lower hemoglobin A1c by 0.6–1.2% when used either as a monotherapy or with other oral diabetes medications [32–34]. One prospective study compared metabolic outcomes in patients with prolactinoma treated with pituitary surgery vs. dopamine agonists; the two groups had similar baseline prolactin levels, but at 12-month follow-up, prolactin levels were significantly reduced in the pituitary surgery group and only slightly reduced in the dopamine agonist group, and neither group had normalized prolactin levels [35]. This study found a significant improvement in lipid metabolism in those treated with pituitary surgery, while suppressing prolactin more gradually using dopamine agonists seemed to have a stronger impact on gluco-insulinemic profile, as high-dose cabergoline (≥2 mg/week) resulted in significantly increased insulin secretion and peripheral sensitivity [35]. These results suggest that, in addition to the level to which prolactin is suppressed, the mechanism and rate of prolactin suppression may influence the overall metabolic impact.
While we chose to focus on patients with prolactinoma, much of the existing data on prolactin and metabolism comes from studies in non-prolactinoma patients. For example, a recent study on hypoprolactinemia supports a basal prolactin cutoff of 5 mcg/L for males and 7 mcg/L for females for normal prolactin reserve [30]. However, none of the cited studies examined patients being treated for prolactinoma, and were instead focused on other etiologies such as Sheehan’s syndrome, traumatic brain injury, subarachnoid hemorrhage, severe growth hormone deficiency, and panhypopituitarism, all of which were excluded in our study [30]. Our literature review also identified seven studies in large, mixed populations of mostly non-prolactinoma patients (Table 2); while these studies did not meet the inclusion criteria for our meta-analysis, they provided data of interest on metabolic measures stratified by prolactin quartiles. Of these seven studies, one did not publish p-values, while five of the remaining six studies reported a statistically significant trend in at least one of the metabolic risk measures selected in our study (BMI, LDL, or HOMA-IR). One study of 2,531 men being assessed for sexual dysfunction, with mean testosterone levels within normal limits, found a statistically significant, inverted U-shaped association between prolactin and BMI, such that the second quartile of prolactin (5.1–7 mcg/L) had the highest BMI, compared to lower (< 5 mcg/L) and higher (7.1–34.9 mcg/L) quartiles of prolactin (p < 0.05) [20]. A prospective study of 2,377 men and women without hyperprolactinemia concluded that higher prolactin is associated with impaired glucose regulation and diabetes; however, further investigation into their data shows that in women, rising prolactin was associated with decreasing HOMA-IR (p = 0.01), where the lowest quartile was prolactin < 6.74 mcg/L and the highest quartile was prolactin > 11.5 mcg/L [36]. A retrospective study including 792 infertile women with PCOS noted a similar trend of decreasing HOMA-IR with rising prolactin (p = 0.01), where the lowest quartile was prolactin < 8.81 mcg/L and the highest quartile was prolactin > 15 mcg/L [37]. Another retrospective study including 2,052 infertile women with PCOS noted that both BMI and LDL decreased with rising prolactin (p = 0.00 and 0.01, respectively), where the lowest quartile was prolactin < 9.24 mcg/L and the highest quartile was prolactin > 15.94 mcg/L [38]. Note that these studies assessed very different patient populations than those included in our study, and it is difficult to extrapolate from data stratified by quartiles, but it is interesting that with larger sample sizes and wider ranges of prolactin levels, these studies found statistically significant associations between prolactin and metabolic measures that were not necessarily linear.
Future directions for research should include conducting a randomized controlled trial examining this research question, including more metabolic measures, and then corroborating findings in non-prolactinoma patient populations.
Conclusion
This systematic review and meta-analysis did not demonstrate a statistically significant association between prolactin levels and the metabolic risk measures selected in our study (BMI, LDL, HOMA-IR) in patients with prolactinoma. These findings suggest that suppressing prolactin levels to below 15 mcg/L may not have as significant a metabolic impact as previously believed; however, there was limited assessment of very suppressed prolactin levels due to data availability. Further investigation of the metabolic effects of hypoprolactinemia is warranted.
| Author and year | Study type | Sample size (n female) | Follow-up since treatment initiation (months) | Pre-treatment prolactin (mcg/L) | Post-treatment prolactin (mcg/L) | Pre-treatment BMI (kg/m2) | Post-treatment BMI (kg/m2) | Pre-treatment LDL (mg/dL) | Post-treatment LDL (mg/dL) | Pre-treatment HOMA-IR | Post-treatment HOMA-IR |
| Andereggen et al. [32] (DA) | Retrospective | 18 (8) | 51.9 | 3,042 | 16.3 | 28.6 | 27.2 | 135.3 | 143.1 | NA | NA |
| Andereggen et al. [32] (PS) | Retrospective | 12 (5) | 51.9 | 2,504.7 | 12.33 | 27.7 | 26.4 | 139.2 | 116 | NA | NA |
| Auriemma et al. [39] | Prospective | 61 (48) | 12 | 789.3 | 8.4 | 27.6 | 24.3 | 126 | 97.8 | 3.2 | 1.2 |
| Auriemma et al. [40] | Prospective | 32 (0) | 12 | 95.3 | 21.8 | 31.7 | 30.4 | 142.3 | 120.3 | 4.1 | 2.7 |
| Berinder et al. [17] | Prospective | 14 (8) | 6 | 3,254.3 | 10.7 | NA | NA | 131.5 | 112.1 | 3.9 | 2.1 |
| Ciresi et al. [41] | Retrospective | 43 (35) | 12 | 174.6 | 24.9 | 25.6 | 25.4 | 110.2 | 93.6 | 3.9 | 2.9 |
| dos Santos Silva et al. [16] | Prospective | 22 (17) | 6 | 310 | 52.6 | 29.1 | 28.5 | 138 | 108.3 | 7.3 | 5.7 |
| Inancli et al. [42] | Prospective | 21 (21) | 6 | 151 | 12.4 | 27.1 | 26.7 | 106.2 | 91.7 | 2.0 | 1.8 |
| Kabootari et al. (female) [43] | Observational | 41 (41) | 6 | 116.8 | 14.2 | 28 | 27.8 | 161.8 | 116.7 | NA | NA |
| Kabootari et al. (male) [43] | Observational | 30 (0) | 6 | 143.8 | 16.4 | 30.7 | 30.5 | 167.6 | 142.5 | NA | NA |
| Khalil et al. [15] | Prospective | 32 (14) | 3 | 611.9 | 24.4 | 28.9 | 24.5 | 127.0 | 92.9 | 1.3 | 0.9 |
| Krysiak et al. [44] | Prospective | 8 (8) | 6 | 43 | 10.2 | 27.5 | NA | 125.3 | 111.0 | 5.3 | 4.1 |
| Pala et al. [45] | Non-randomized matched prospective | 19 (18) | 6 | 118.6 | 9.4 | 24.2 | 23.2 | 112.1 | 77.3 | 1.1 | 1.0 |
| Pirchio et al. [35] (PS) | Prospective | 17 (7) | 12 | 1,354.8 | 77.2 | NA | NA | 124.1 | 112.4 | 3.4 | 3.2 |
| Pirchio et al. [35] (DA) | Prospective | 17 (5) | 12 | 249 | 166.4 | NA | NA | 123.6 | 115.3 | 4.8 | 3.8 |
| Schwetz et al. [46] | Retrospective | 53 (22) | 9 | 404.9 | 11.1 | 27.9 | 28.6 | 121.6 | 110.6 | NA | NA |
Table 1: Characteristics of included studies. Note: For studies that provided median and interquartile range (IQR), these values were converted into mean and standard deviation (SD) using the Meta-Analysis Accelerator conversion tool; the values displayed in this table are means [28]. BMI: body mass index; DA: dopamine agonist; HOMA-IR: homeostatic model assessment for insulin resistance; LDL: low-density lipoprotein; NA: no data reported; PS: pituitary surgery.
| Author and year | | n | Prolactin (mcg/L) | BMI mean | BMI SD | LDL (mg/dL) mean | LDL SD | HOMA-IR mean | HOMA-IR SD |
| Chahar et al. [47] |
| Male | Quartile I | 45 | < 7.2 | 24.90 | 2.50 | NA | NA | NA | NA |
| Quartile II | 45 | 7.2-9.8 | 24.40 | 2.60 | NA | NA | NA | NA |
| Quartile III | 45 | 10-12.6 | 24.20 | 2.60 | NA | NA | NA | NA |
| Quartile IV | 45 | > 12.6 | 23.90 | 2.70 | NA | NA | NA | NA |
| p-value | | | 0.33 | | | | | |
| Female | Quartile I | 30 | < 7.6 | 25.50 | 1.90 | NA | NA | NA | NA |
| Quartile II | 30 | 7.6-10.6 | 25.10 | 1.90 | NA | NA | NA | NA |
| Quartile III | 30 | 10.7-13.4 | 24.70 | 2.30 | NA | NA | NA | NA |
| Quartile IV | 30 | > 13.4 | 24.20 | 2.20 | NA | NA | NA | NA |
| p-value | | | 0.09 | | | | | |
| Corona et al. [20] |
| Quartile I | 624 | < 5 | 26.60 | 3.80 | 131.90 | 31.90 | NA | NA |
| Quartile II | 624 | 5.1-7 | 26.80 | 4.20 | 128.10 | 38.90 | NA | NA |
| Quartile III | 624 | 7.1-11 | 26.30 | 4.10 | 130.10 | 32.30 | NA | NA |
| Quartile IV | 624 | 11.1-34.9 | 26.00 | 4.10 | 124.90 | 33.60 | NA | NA |
| p-value | | | < 0.05 | | < 0.01 | | | |
| Li et al. [48] |
| Quartile I | 2096 | < 8 | 25.50 | 4.80 | NA | NA | NA | NA |
| Quartile II | 2145 | 8-11.1 | 25.50 | 4.90 | NA | NA | NA | NA |
| Quartile III | 2143 | 11.1-15.8 | 25.30 | 4.90 | NA | NA | NA | NA |
| Quartile IV | 2231 | > 15.8 | 25.20 | 4.70 | NA | NA | NA | NA |
| Wang et al. [36] |
| Male | Quartile I | 260 | < 6.4 | 24.80 | 3.00 | NA | NA | 1.73 | 1.19 |
| Quartile II | 257 | 6.41-8.16 | 25.00 | 3.40 | NA | NA | 1.33 | 1.19 |
| Quartile III | 259 | 8.17-10.62 | 25.50 | 3.20 | NA | NA | 1.73 | 1.19 |
| Quartile IV | 258 | > 10.63 | 25.30 | 3.50 | NA | NA | 1.80 | 1.34 |
| p-value | | | 0.05 | | | | 0.20 | |
| Female | Quartile I | 338 | < 6.74 | 25.60 | 3.40 | NA | NA | 2.23 | 1.49 |
| Quartile II | 335 | 6.75-8.86 | 25.10 | 3.70 | NA | NA | 2.03 | 1.49 |
| Quartile III | 335 | 8.87-11.49 | 25.60 | 4.50 | NA | NA | 1.97 | 1.41 |
| Quartile IV | 335 | > 11.5 | 25.90 | 4.20 | NA | NA | 1.93 | 1.34 |
| p-value | | | 0.07 | | | | 0.01 | |
| Wang et al. [49] |
| Male | Quartile I | 154 | 2.21-6.59 | 24.90 | 2.90 | 91.80 | 24.50 | NA | NA |
| Quartile II | 155 | 6.6-8.43 | 24.70 | 3.20 | 91.60 | 26.60 | NA | NA |
| Quartile III | 154 | 8.44-10.66 | 25.00 | 3.00 | 91.40 | 23.00 | NA | NA |
| Quartile IV | 155 | 10.67-19.36 | 24.80 | 3.60 | 85.50 | 25.60 | NA | NA |
| p-value | | | 0.98 | | 0.03 | | | |
| Female | Quartile I | 224 | 3.53-6.88 | 25.30 | 3.20 | 96.70 | 26.20 | NA | NA |
| Quartile II | 222 | 6.89-9.01 | 24.80 | 3.30 | 96.70 | 23.60 | NA | NA |
| Quartile III | 223 | 9.02-11.6 | 25.30 | 4.60 | 95.00 | 26.80 | NA | NA |
| Quartile IV | 223 | 11.61-26.49 | 25.30 | 3.70 | 93.20 | 26.40 | NA | NA |
| p-value | | | 0.58 | | 0.13 | | | |
| Yang et al. [38] |
| Quartile I | 512 | < 9.24 | 23.33 | 3.57 | 104.40 | 28.75 | NA | NA |
| Quartile II | 515 | 9.24-11.98 | 22.93 | 3.87 | 101.83 | 25.88 | NA | NA |
| Quartile III | 509 | 11.99-15.94 | 22.63 | 4.16 | 100.54 | 28.75 | NA | NA |
| Quartile IV | 516 | > 15.94 | 22.30 | 3.57 | 100.54 | 28.75 | NA | NA |
| p-value | | | 0.00 | | 0.01 | | | |
| Yang et al. [37] |
| Quartile I | 175 | < 8.81 | 25.62 | 3.78 | 107.11 | 24.00 | 2.77 | 2.16 |
| Quartile II | 170 | 8.82-11.12 | 23.29 | 2.41 | 100.67 | 33.54 | 2.59 | 1.64 |
| Quartile III | 232 | 11.12-15 | 23.04 | 4.00 | 104.80 | 23.08 | 2.48 | 1.95 |
| Quartile IV | 215 | > 15 | 22.59 | 3.12 | 112.40 | 27.13 | 2.19 | 1.73 |
| p-value | | | 0.10 | | 0.81 | | 0.01 | |
Table 2: Additional studies investigating metabolic measures stratified by prolactin quartiles. BMI: body mass index; HOMA-IR: homeostatic model assessment for insulin resistance; LDL: low-density lipoprotein; NA: no data reported; SD: standard deviation.
Funding
The authors received no financial support for the research, authorship, and/or publication of this project.
Authors Contributions
Agrawal N and Jordan G conceived the study. McQuade EC, Ruddy M, Lo Piccolo AJ, Jordan G, and Agrawal N all contributed to the systematic review process, including literature search, abstract screening, full-text review, and data extraction. Lee T-F analyzed the data. McQuade EC, Ruddy M, and Lo Piccolo AJ wrote the first draft of the manuscript with contributions from all authors. All authors have approved the final manuscript.
Acknowledgements
Figure 1 was created by Kristen Dancel-Manning.
References
- Freeman ME, Kanyicska B, Lerant A, et al. Prolactin: structure, function, and regulation of secretion. Physiol Rev. 2000;80(4):1523-631.
- Al-Chalabi M, Bass AN, Alsalman I. Physiology, Prolactin.: StatPearls Publishing. 2023.
- Macotela Y, Triebel J, Clapp C. Time for a New Perspective on Prolactin in Metabolism. Trends Endocrinol Metab. 2020;31(4):276-286.
- Ben-Jonathan N, Hugo ER, Brandebourg TD, et al. Focus on prolactin as a metabolic hormone. Trends Endocrinol Metab. 2006;17(3):110-6.
- Brelje TC, Parsons JA, Sorenson RL. Regulation of islet beta-cell proliferation by prolactin in rat islets. Diabetes. 1994;43(2):263-73.
- Shao S, Yao Z, Lu J, et al. Ablation of prolactin receptor increases hepatic triglyceride accumulation. Biochem Biophys Res Commun. 2018;498(3):693-699.
- Yu J, Xiao F, Zhang Q, et al. PRLR regulates hepatic insulin sensitivity in mice via STAT5. Diabetes. 2013;62(9):3103-13.
- Ruiz-Herrera X, de Los Ríos EA, Díaz JM, et al. Prolactin Promotes Adipose Tissue Fitness and Insulin Sensitivity in Obese Males. Endocrinology. 2017;158(1):56-68.
- Shibli-Rahhal A, Schlechte J. The effects of hyperprolactinemia on bone and fat. Pituitary. 2009;12(2):96-104.
- Brandebourg T, Hugo E, Ben-Jonathan N. Adipocyte prolactin: regulation of release and putative functions. Diabetes Obes Metab. 2007;9(4):464-76.
- Al Sabie F, Tariq Z, Erickson D, et al. Association Between Prolactinoma and Body Mass Index. Endocr Pract. 2021;27(4):312-317.
- Posawetz AS, Trummer C, Pandis M, et al. Adverse body composition and lipid parameters in patients with prolactinoma: a case-control study. BMC Endocr Disord. 2021;21(1):81.
- Park S, Kim DS, Daily JW, et al. Serum prolactin concentrations determine whether they improve or impair β-cell function and insulin sensitivity in diabetic rats. Diabetes Metab Res Rev. 2011;27(6):564-74.
- Byberg S, Futtrup J, Andreassen M, et al. Metabolic effects of dopamine agonists in patients with prolactinomas: a systematic review and meta-analysis. Endocr Connect. 2019;8(10):1395-1404.
- Khalil G, Khan FA, Jamal QM, et al. Change in Insulin Sensitivity and Lipid Profile After Dopamine Agonist Therapy in Patients With Prolactinoma. Cureus. 2021;13(9):e17824.
- dos Santos Silva CM, Barbosa FR, Lima GA, et al. BMI and metabolic profile in patients with prolactinoma before and after treatment with dopamine agonists. Obesity (Silver Spring). 2011;19(4):800-5.
- Berinder K, Nyström T, Höybye C, et al. Insulin sensitivity and lipid profile in prolactinoma patients before and after normalization of prolactin by dopamine agonist therapy. Pituitary. 2011;14(3):199-207.
- Ponce AJ, Galván-Salas T, Lerma-Alvarado RM, et al. Low prolactin levels are associated with visceral adipocyte hypertrophy and insulin resistance in humans. Endocrine. 2020;67(2):331-343.
- Maseroli E, Verde N, Cipriani S, et al. Low prolactin level identifies hypoactive sexual desire disorder women with a reduced inhibition profile. J Endocrinol Invest. 2023;46(12):2481-2492.
- Corona G, Mannucci E, Jannini EA, et al. Hypoprolactinemia: a new clinical syndrome in patients with sexual dysfunction. J Sex Med. 2009;6(5):1457-66.
- Krysiak R, Kowalcze K, Okopień B. Sexual function and depressive symptoms in men with hypoprolactinaemia secondary to overtreatment of prolactin excess: A pilot study. Endocrinol Diabetes Nutr (Engl Ed). 2022;69(4):279-288.
- Corona G, Wu FC, Rastrelli G, et al. Low prolactin is associated with sexual dysfunction and psychological or metabolic disturbances in middle-aged and elderly men: the European Male Aging Study (EMAS). J Sex Med. 2014;11(1):240-53.
- Kirsch P, Kunadia J, Shah S, et al. Metabolic effects of prolactin and the role of dopamine agonists: A review. Front Endocrinol (Lausanne). 2022;13:1002320.
- Auriemma RS, Scairati R, Pirchio R, et al. Cardiometabolic effects of hypoprolactinemia. Rev Endocr Metab Disord. 2024;25(6):1065-1075.
- Thapa S, Bhusal K. Hyperprolactinemia: StatPearls. 2025.
- Inder WJ, Jang C. Treatment of Prolactinoma. Medicina (Kaunas). 2022;58(8):1095.
- Canadian Society of Clinical Chemists position paper: standardization of selected polypeptide hormone measurements. Clin Biochem. 1992;25(6):415-24.
- Abbas A, Hefnawy MT, Negida A. Meta-analysis accelerator: a comprehensive tool for statistical data conversion in systematic reviews with meta-analysis. BMC Med Res Methodol. 2024;24(1):243.
- Dias AC, Jácomo RH, Nery LFA, et al. Effect size and inferential statistical techniques coupled with machine learning for assessing the association between prolactin concentration and metabolic homeostasis. Clin Chim Acta. 2024;552:117688.
- Urhan E, Karaca Z. Diagnosis of hypoprolactinemia. Rev Endocr Metab Disord. 2024;25(6):985-993.
- Pijl H, Ohashi S, Matsuda M, et al. Bromocriptine: a novel approach to the treatment of type 2 diabetes. Diabetes Care. 2000;23(8):1154-61.
- Andereggen L, Frey J, Andres RH, et al. Impact of primary medical or surgical therapy on prolactinoma patients’ BMI and metabolic profile over the long-term. J Clin Transl Endocrinol. 2021;24:100258.
- Scranton R, Cincotta A. Bromocriptine–unique formulation of a dopamine agonist for the treatment of type 2 diabetes. Expert Opin Pharmacother. 2010;11(2):269-79.
- Holt RI, Barnett AH, Bailey CJ. Bromocriptine: old drug, new formulation and new indication. Diabetes Obes Metab. 2010;12(12):1048-57.
- Pirchio R, Auriemma RS, Solari D, et al. Effects of Pituitary Surgery and High-Dose Cabergoline Therapy on Metabolic Profile in Patients With Prolactinoma Resistant to Conventional Cabergoline Treatment. Front Endocrinol (Lausanne). 2021;12:769744.
- Wang T, Lu J, Xu Y, et al. Circulating prolactin associates with diabetes and impaired glucose regulation: a population-based study. Diabetes Care. 2013;36(7):1974-80.
- Yang H, Lin J, Li H, Liu Z, Chen X, Chen Q. Prolactin Is Associated With Insulin Resistance and Beta-Cell Dysfunction in Infertile Women With Polycystic Ovary Syndrome. Front Endocrinol (Lausanne). 2021;12:571229.
- Yang H, Di J, Pan J, et al. The Association Between Prolactin and Metabolic Parameters in PCOS Women: A Retrospective Analysis. Front Endocrinol (Lausanne). 2020;11:263.
- Auriemma RS, Granieri L, Galdiero M, et al. Effect of cabergoline on metabolism in prolactinomas. Neuroendocrinology. 2013;98(4):299-310.
- Auriemma RS, Galdiero M, Vitale P, et al. Effect of chronic cabergoline treatment and testosterone replacement on metabolism in male patients with prolactinomas. Neuroendocrinology. 2015;101(1):66-81.
- Ciresi A, Amato MC, Guarnotta V, et al. Higher doses of cabergoline further improve metabolic parameters in patients with prolactinoma regardless of the degree of reduction in prolactin levels. Clin Endocrinol (Oxf). 2013;79(6):845-52.
- Inancli SS, Usluogullari A, Ustu Y, et al. Effect of cabergoline on insulin sensitivity, inflammation, and carotid intima media thickness in patients with prolactinoma. Endocrine. 2013;44(1):193-9.
- Kabootari M, Shirmohammadli H, Golgiri F, et al. Metabolic effects of dopamine-agonists treatment among patients with prolactinomas. Endocrine. 2023;79(3):537-544.
- Krysiak R, Okopien B. Different effects of cabergoline and bromocriptine on metabolic and cardiovascular risk factors in patients with elevated prolactin levels. Basic Clin Pharmacol Toxicol. 2015;116(3):251-6.
- Pala NA, Laway BA, Misgar RA, et al. Metabolic abnormalities in patients with prolactinoma: response to treatment with cabergoline. Diabetol Metab Syndr. 2015;7:99.
- Schwetz V, Librizzi R, Trummer C, et al. Treatment of hyperprolactinaemia reduces total cholesterol and LDL in patients with prolactinomas. Metab Brain Dis. 2017;32(1):155-61.
- Chahar C, Chahar K, Ankit BS, et al. Association of Serum Prolactin Level with Impaired Glucose Regulation and Diabetes. J Assoc Physicians India. 2017;65(3):34-39.
- Li J, Rice MS, Huang T, et al. Circulating prolactin concentrations and risk of type 2 diabetes in US women. Diabetologia. 2018;61(12):2549-2560.
- Wang T, Xu Y, Xu M, et al. Circulating Prolactin and Risk of Type 2 Diabetes: A Prospective Study. Am J Epidemiol. 2016;184(4):295-301.
