Abstract
Heart rate variability (HRV) is defined as the momentary variation in the end heart rate (EHR) estimated at various intervals (time domains), such as from 2 min (ultra-short HRV) to 24 h (long HRV) intervals. The R peak interval (RRI) between two consecutive beats called momentary heart rate (MHR) provides insight into the impending cardiovascular risk and not the EHR. The autonomic nervous system (ANS) is in charge of maintaining physiological homeostasis by keeping the MHR and in turn the EHR within the normal range of 60–100 bpm. ANS has two components – the sympathetic nervous system (SNS) and the parasympathetic nervous system (PNS). The former increases HR (reduces RRI) while the latter reduces it. Therefore, the RR time-domain-HRV-data (THD) provides better insight into overall health than the EHR. Six types of THDs, e.g., mean-HR, mean-RR, SDNN, SDHR, RMSSD, and pNN50 are discussed in this article.
Keywords
RR interval, HRV, ANS, time-domain analysis, SDNN, SDHR, RMSSD, pNN50
Abbreviations
HR: heart rate; HRV: heart rate variability; EHR: end heart rate; MHR: momentary heart rate; ANS: autonomic nervous system; SNS: sympathetic nervous system; PNS: parasympathetic nervous system; THD: time-domain-HRV-data; ECF: electroconductive fibers; ROC: rate of contraction; FOC: force of contraction; ECG: electrocardiogram; TDH: time-domain HRV; AS: autonomic stress
Introduction
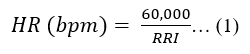
Heart rate (HR) is the most essential vital parameter in clinical practice as it reflects the overall health status of an individual. At the end of any given time frame, the HR that is obtained is called an end heart rate (EHR). A healthy heart uses its unique electromechanical property which is not a metronome. Thus, during that said time domain, variations in the HR can be a normal occurrence, known as momentary heart rate (MHR). Therefore, MHRs are the entire tale-tell events between the starting HR to the EHR. The electroconductive fibers (ECF) supplying to its muscles (myocardium) all-round help it mechanically pump the blood to the body [1]. The ECF regulates the rate of contraction (ROC). The contraction of the myocardium is heavily dependent on the availability of calcium ions to generate an action potential (via the ionotropic effect), the key determinant of the force of contraction (FOC) [2]. The sinoatrial node (SAN) initiates electrical impulses and regulates the HR. During autonomic control (control by the autonomic nervous system or ANS), the overdrive sympathetic nervous system (SNS) causes the release of catecholamines which exert their ionotropic effect via cardiac beta-1 and 2 adrenergic receptors increasing both the ROC and the FOC [3]. On the other hand, the parasympathetic nervous system (PNS) decreases both. Together, the SNS and the PNS maintain the physiological balance or homeostasis or equilibrium of the heart. Electrocardiogram (ECG) is the line plot of the ROC and FOC and thereby the state of homeostasis at a particular time stamp. In the ECG, along the x-axis are the P and R peaks, representing the atrial and ventricular contractions and their respective rates in milliseconds (ms). The peaks presented along the y-axis determine the FOC (the ionotropic effect of the myocardium) while the number of consecutive peaks at a particular time frame in milliseconds (ms) refers to the ROC. The ECG is recorded at a speed of 25 mm/sec so that each small square of 1 mm size represents 0.04 sec while a large square consisting of five small squares represents 0.2 sec [4]. A normal RRI varies between 0.6–1.2 sec [5]. As the healthy heart is not a metronome, the HR varies within a period (called heart rate variability or HRV) according to the variations of the consecutive R-R intervals (RRI), the most crucial representation of the ANS control. The intermediate HR between two adjacent beats can be computed by dividing a minute expressed in milliseconds (ms) by RRI (refer to equation 1) and normally it varies between two successive timestamps. This information is therefore critical to computing the HRV with any time domain, which could be a short (2–5 min) or long (24 h) type as mentioned above. The R-R interval is also termed the ‘normal to normal’ or N-N interval when the ectopic beats are discarded as found in the ECG waves. As the R-R intervals vary, the HR also varies across time in a healthy heart.
 Summarily, a healthy heart shows momentary variation in the HR due to autonomic influence. The HRV thereby signifies the mental and metabolic health state of an individual quite effectively.
Time-Domain HRV
The time-domain HRV (TDH) reflects autonomic homeostasis, which is crucial for assessing the mental and metabolic health of an individual. Two other domains of HRV are frequency domain and non-linear variables, such as LF, HF, VLF, VHF and SD1, and SD2, respectively [6]. Interestingly the TDH such as RMSSD (discussed below) value correlates with the HF, VHF, and SD1, which represent the PNS compensation [6]. Below discussed are some of the important types of TDH.
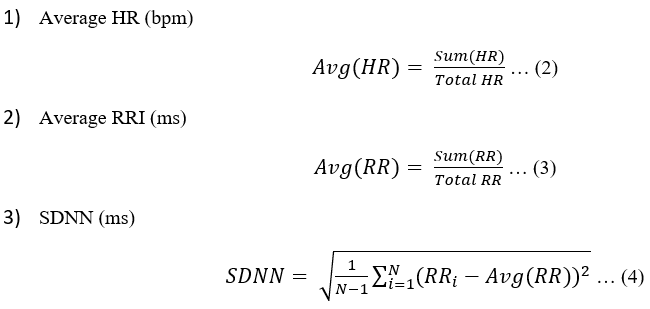 SD denotes the standard deviation, the number of beats that vary from 1 to N minus the ectopic beats while counting the N. ‘N’ refers to the normal beat (i.e., beat minus ectopic). SDNN is highly correlated with ULF, VLF, LF (i.e., the SNS activities), and the total power band than the HF power band. Hence, the contribution of low-frequency bands is more than the high-frequency bands in generating SDNN, especially in 24 h monitoring. Therefore, SDNN calculation is more accurate when monitored for 24 h than short term and is considered the gold standard in predicting cardiovascular risk.
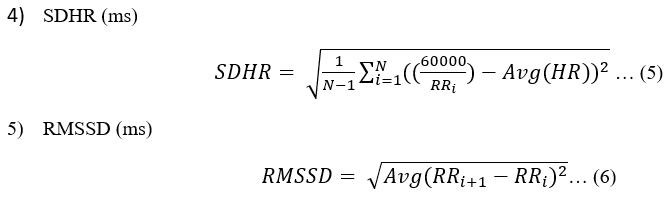 RMS denotes the root mean square. It is the principal TDH biomarker of the PNS activity and therefore highly correlates the HF power and SD1. RMSSD is not affected by the RSA. It is the most important HRV parameter (gold standard) in the elderly population.
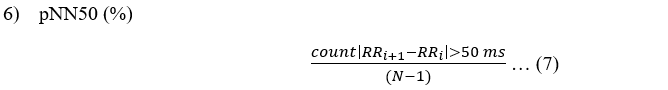
The number of RRIs or NNs > 50 ms is taken into account. It is correlated to the RMSSD and HF power and thus, reflects the PNS activity.
Dynamic Control of Cardiac Rhythm
The dynamic relationship of SNS-PNS systems is highly non-linear and complex in a healthy heart. While the SNS predominates during both mental and physical activities that require more energy (oxygen, glucose, etc.), PNS actions occur when the body needs to be resting. The SNS and PNS both are needed for the normal functioning of the body in a balanced form. It is important to note that the PNS activation (less than 1 sec) is faster than the SNS (more than 5 sec) [7]. This regulatory adjustment is to bring the body to a state of homeostasis faster when it encounters autonomic stress (AS) due to any reason, such as threat perception to take action to combat the threat. SNS drive normally suppresses PNS actions, but its overdrive as mentioned before, activates PNS and the phenomenon is called the ‘PNS reactivity’ [8]. Therefore, studies have observed that the PNS reactive state after aerobic exercise when the body is still in the SNS hyperactive state causes sinus arrhythmia (the heart is beating in a confusing state as to which one to prioritize at that time domain) [9]. In a healthy heart, the RSA can be elevated by deep and slow breathing as it is vagal-tone-independent [10].
Advantage of Time-Domain HRV
The HRV parameters give the health state. The SDNN, RMSSD, and pNN50 are the key HRV parameters reflecting the parasympathetic compensation (desired) in response to the sympathetic stress at the desired level to maintain physiological homeostasis. Therefore, these are also indicators of mental, metabolic, circadian, and gut health [6]. It is normally expected that their values should be on the higher side, referring to a sustained higher compensatory effort for maintaining a good end health state. However, too high HRV could be pathological, which is due to a state of ‘hyper-recovery’ when no other physiological responses are available to combat an exuberant level of AS [11], such as when cortisol (the stress hormone) and then adrenaline are exhausted due to the hypothalamic-pituitary-adrenal axis failure as seen in the pathological stage of shock. Too high HRV can also be an indicator of cardiac pathology that slows down the ECF and thereby the HR, e.g., in various types of heart blocks [12]. Hence, an ECG is mandatory to diagnose the core issue and treat it without losing much time. The normal range of SDNN for a ‘healthy’ subject is > 100 ms, while < 50 ms and 50–100 ms are defined as ‘unhealthy’ (5-times more risk of mortality), and ‘compromised’ health [13]. The normal RMSSD levels for young males and females are 53.5–82 and 29–65 ms, respectively [14]. However, it is important to note that a lower RMSSD value in epileptics indicates a high-grade health risk [15]. The value of pNN50 is pretty straightforward e.g., values > 3% denote ‘healthy’ and unhealthy otherwise [16]. In the elderly population (both genders), the values of SDNN and RMSSD are decreased. In the 60, 70, and 80 years of age groups, the normal SDNN values are 68–186, 62–172, and 57–159 ms, respectively; while the RMSSD values are 11–45, 9–38, and 8–32 ms, respectively [6]. It is interesting to note that a ‘U’ pattern can be noted in the elderly population which means post 70 years of age, RMSSD and pNN50 rise [6]. The reason for such an occurrence is still unclear.
Conclusion
The excerpt from the article is as follows:
- HRV parameters reflect the autonomic modulation of the heart for a given period. The ANS activity is multifactor and highly complex. Environmental factors coupled with internal metabolic factors largely influence it. In a healthy state, it is ‘balanced’, which is again momentary or inconsistent at any given state of health.
- The PNS-SNS balance is called autonomic homeostasis, which governs the health stratifications as the balance is never been perfect.
- A long HRV estimation of 24 h is always the best to predict the health state of an individual. It is because of the score to capture and analyze more data. In the case of SDNN, 24 h HRV monitoring is preferred as short-term monitoring cannot provide any authentic clue to stratify health.
- HRV parameters give a momentary health state, especially cardiovascular health. Because these are sensitive to various internal and external factors that keep changing. It is worth noting that, using the HRV parameters, diseases cannot be diagnosed, but the patterns of these parameters can be examined in any given disease spectrum by conducting longitudinal studies or a large-sampled cross-sectional study.
- RMSSD and pNN50 are two key HRV parameters to evaluate the health state at a given period. These two parameters are useful especially in the elderly population as RSA cannot affect it. Lower values pose a health risk in all age groups, even in the short and ultra-short-term HRV measurement.
Conflicts of Interest
References
- Menefee W, Jenks J, Mazzasette C, et al. Cardiac muscle and electrical activity. 2021.
- Eisner DA, Caldwell JL, Kistamás K, et al. Calcium and excitation-contraction coupling in the heart. Circ Res. 2017;121(2):181-95.
- Szymanski MW, Singh DP. Isoproterenol. Treasure Island: StatPearls Publishing;
- Cadogan M, Buttner R. ECG Rate Interpretation. 2022.
- Rosenthal L. Normal electrocardiography (ECG) intervals. 2020.
- Shaffer F, Ginsberg JP. An overview of heart rate variability metrics and norms. Front Public Health. 2017;5:258.
- Nunan D, Sandercock GR, Brodie DA. A quantitative systematic review of normal values for short-term heart rate variability in healthy adults. Pacing Clin Electrophysiol. 2010;33(11):1407-17.
- Gellhorn E. Autonomic imbalance and the hypthalamus: implications for physiology, medicine, psychology, and neuropsychiatry. London: Oxford University Press;1957.
- Billman GE. The LF/HF ratio does not accurately measure cardiac sympatho-vagal balance. Front Physiol. 2013;4:26.
- Laborde S, Mosley E and Thayer JF. Heart rate variability and cardiac vagal tone in psychophysiological research – recommendations for experiment planning, data analysis, and data reporting. Front. Psychol. 2017;8:213.
- Menon V. The 8 Biggest Mistakes Made When Measuring Heart Rate Variability. 2021.
- ChuDuc H, NguyenPhan K, NguyenViet D. A review of heart rate variability and its applications. APCBEE Procedia. 2013;7:80-85.
- Kleiger RE, Miller JP, Bigger JT Jr, et al. Decreased heart rate variability and its association with increased mortality after acute myocardial infarction. Am J Cardiol. 1987;59(4):256-62.
- What normal ranges and measurement standards we use to interpret your heart rate variability. 2022.
- DeGiorgio CM, Miller P, Meymandi S, et al. RMSSD, a measure of vagus-mediated heart rate variability, is associated with risk factors for SUDEP: the SUDEP-7 Inventory. Epilepsy Behav. 2010;19(1):78-81.
- Corrales MM, Torres BdlC, Esquivel AG, et al. Normal values of heart rate variability at rest in a young, healthy and active Mexican population. Health. 2012;4(7):377-85.
