Abstract
Carbohydrate antigen 19-9 (CA 19-9) can rise in subsets of colorectal cancer (CRC), most prominently in mucinous phenotypes and tumors that elaborate secreted mucin glycoproteins, even when inflammatory cytokines such as interleukin 6 (IL-6) are normal or declining. Here, we expand the mechanistic rationale for this biomarker discordance and convert it into a concise, testable clinical workflow. First, CA 19-9 expression reflects the sialyl Lewis^a (sLe^a) epitope carried on mucins such as MUC1/MUC5AC; once the underlying glycosylation machinery is engaged (e.g., FUT3 and ST3Gal-III), biosynthesis can continue despite suppression of NF-κB/STAT3-linked inflammatory signaling, yielding persistent antigen shedding even as IL-6 falls. Second, hypoxia and angiogenic drive provide an inflammation-independent route to heightened mucin production: stabilization of HIF-1α and induction of VEGF promote glycoprotein synthesis and increase cellular turnover in hypoxic niches, augmenting CA 19-9 release without elevating systemic cytokines. Third, subclonal evolution can generate phenotypic decoupling; emergent KRAS/BRAF/TP53-altered clones may display a mucin-high, inflammation-low program, producing rising CA 19-9 while IL-6 remains quiescent. Fourth, extratumoral sources, especially cholestasis, biliary obstruction, or cholangitis, raise CA 19-9 independent of cancer activity and must be considered whenever imaging is stable. Fifth, effective therapy can transiently elevate CA 19-9 via tumor lysis or exosome-mediated shedding even as overall inflammatory tone declines, creating short-lived spikes that should be interpreted in a temporal context.
Operationally, we propose an imaging anchored algorithm that integrates molecular and biochemical stratification. The trigger is a verified CA 19-9 rise with low/normal IL-6. Step 1: perform contrast CT/MRI to assess for new or enlarging lesions and add ultrasound/MRCP when symptoms or cholestatic laboratory values suggest a biliary contribution. Step 2a (progression present): obtain circulating tumor DNA (ctDNA) to detect emergent KRAS/BRAF/TP53 subclones and, when clinically appropriate, escalate toward targeted or combination therapy while continuing to track CA 19-9, CEA, and ctDNA response. Step 2b (no radiographic progression): evaluate the hepatobiliary tree with bilirubin, alkaline phosphatase, γ-glutamyltransferase, and ultrasound/MRCP; treat obstruction or inflammation and repeat markers after resolution. If biliary evaluation is negative, Step 3: deploy a stratification panel, MUC1/MUC5AC expression, FUT3/ST3Gal-III activity, and hypoxia/angiogenesis markers (HIF-1α, VEGF), to document an inflammation-independent mucin/glycan drive; integrate conventional markers (CEA, LDH-A, β2-microglobulin) to contextualize tumor burden. Finally, reassess trends after any therapeutic change to distinguish true progression from treatment transient release.
This framework clarifies three common scenarios: (A) subclone driven progression (new lesions plus positive ctDNA) warranting escalation despite low IL-6; (B) biliary confounding (stable imaging with cholestatic tests) prompting biliary management and deferred oncologic change; and (C) therapy related transients (post treatment CA 19-9 spikes with improving imaging and falling IL-6) best managed by continued monitoring. Overall, rising CA 19-9 with low IL-6 is biologically coherent and clinically interpretable when framed by mucin biology, hypoxia, clonal dynamics, and hepatobiliary physiology. The proposed stepwise algorithm, imaging first; ctDNA when progression; biliary tests when stable; optional mucin/glycosylation/hypoxia profiling; iterative reassessment, aims to prevent misinterpretation of isolated CA 19-9 rises and to guide timely, mechanism-appropriate decisions, including escalation toward targeted therapy when clonal evolution is identified.
Full Text PDF
Keywords
CA 19-9, IL-6, colorectal cancer, mucins (MUC1/MUC5AC), glycosylation (FUT3, ST3Gal-III), hypoxia (HIF-1α), ctDNA, biliary obstruction, subclonal evolution
Abbreviations
CA 19-9: carbohydrate antigen 19-9; CRC: colorectal cancer; CT: computed tomography; MRI: magnetic resonance imaging; MRCP: magnetic resonance cholangiopancreatography; ctDNA: circulating tumor DNA; sLe^a: sialyl Lewis^a; IL-6: interleukin 6; HIF-1α: hypoxia-inducible factor 1 alpha; CEA: carcinoembryonic antigen; NF-κB: nuclear factor kappa-light-chain-enhancer of activated B cells; VEGF: vascular endothelial growth factor; ALP: alkaline phosphatase; GGT: gamma-glutamyl transferase; LDH: lactate dehydrogenase
Introduction
Carbohydrate antigen 19-9 (CA 19-9) is a sialyl Lewis^a (sLe^a) glycan epitope displayed on mucin-type glycoproteins; its biosynthesis depends on coordinated fucosylation and sialylation pathways that are often remodeled in cancer [1, 2]. Although best known in pancreaticobiliary disease, CA 19-9 may track tumor burden in mucinous colorectal cancer (CRC) and in tumors with high mucin output [3, 4]. Parallel monitoring of inflammatory signals (e.g., IL-6) is common because interleukin 6 (IL-6)–STAT3/NF-κB axes regulate mucin gene programs and malignant inflammation [5, 6]. Yet intratumor heterogeneity and branched evolution mean that biomarker coupling can break: subclones may acquire phenotypes that elevate CA 19-9 without proportionate IL-6 signaling [7]. Moreover, cholestasis and other biliary processes can elevate CA 19-9 independent of cancer activity, confounding interpretation unless imaging and liver/biliary tests are performed [8]. Contemporary CRC guidance stresses biomarker context and multimodal assessment [9]. We consolidate mechanisms for CA 19-9↑/IL-6↓ and propose a pragmatic workup (Figure 1).
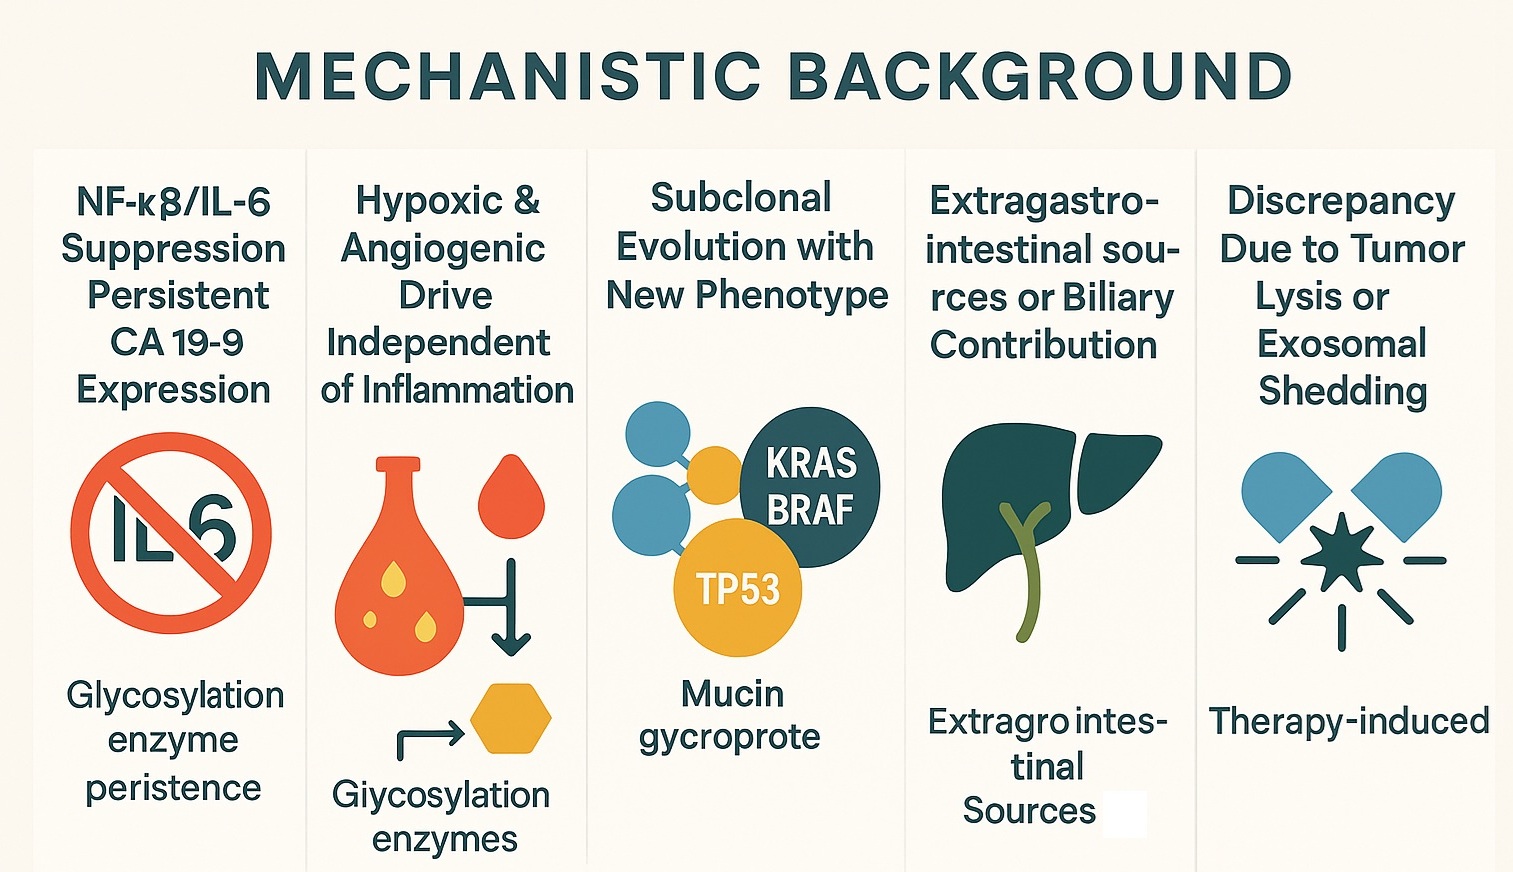 Figure 1: Mechanistic background summarizing five causes of CA 19‑9↑ with IL‑6↓ (NF‑κB/IL‑6 suppression with persistent glycosylation; hypoxia/angiogenesis; subclonal evolution; biliary sources; therapy‑related shedding). (Based on the provided artwork)
Clinical dogmas for practice
- D1 – Never act on a single CA 19-9 rise; confirm with a repeat measurement and interpret alongside CEA, IL-6, and treatment timing [4, 9].
- D2 – A rising CA 19-9 with stable CEA raises two immediate possibilities: mucin-dominant subclone or biliary confounder; investigate both in parallel [3, 4, 8, 9].
- D3 – Consider host glycosylation biology (g., Lewis/secretor background) and enzyme activity when CA 19-9 behaves atypically; tumor-independent factors can shape expression [1, 2].
- D4 – Imaging anchors decisions; biomarkers refine them. Escalation without radiologic or molecular corroboration risks overtreatment [7, 9].
Mechanistic Background
NF-κB/IL-6 pathway suppression with persistent glycosylation
Anti-inflammatory strategies may decrease IL-6 and blunt STAT3/NF-κB activity, but CA 19-9 can remain high if the glycosylation apparatus (e.g., FUT3, ST3Gal-III) continues to generate sLe^a on MUC1/MUC5AC [1, 2]. Hence, a biochemical “decoupling” between inflammation and mucin glycan synthesis is plausible [2, 5, 6]. Practically, patients on anti-cytokine regimens (or improving systemic inflammation) may show falling IL-6 while CA 19-9 plateaus or rises because the tumor retains an autonomous mucin/glycan program. Assay consistency (same platform) and timing relative to anti-inflammatory therapy are essential when judging trends (Figure 1).
Dogma: When IL-6 decreases, but CA 19-9 does not, assume persistent glycosylation until proven otherwise; verify mucin phenotype (MUC1/MUC5AC) and, when feasible, infer glycosyltransferase activity from tissue/serum correlates [1, 2] (Figure 2).
Hypoxia and angiogenic drive independent of IL-6
Hypoxia stabilizes HIF-1α and induces VEGF, which can enhance mucin production and glycan elaboration even when systemic IL-6 is low [1, 2]. Tumor hypoxia also increases cellular turnover and shedding of glycoproteins, contributing to serum CA 19-9 [2]. Clinically, hypoxia-dominant disease may present with slow systemic inflammatory tone but progressive mucin-rich lesions; anti-angiogenic exposure can also transiently alter shedding patterns.
Dogma: If IL-6 is quiescent yet the tumor is radiologically active, think HIF-1α/VEGF programs; document by imaging behavior and optional hypoxia markers before changing systemic therapy [1, 2].
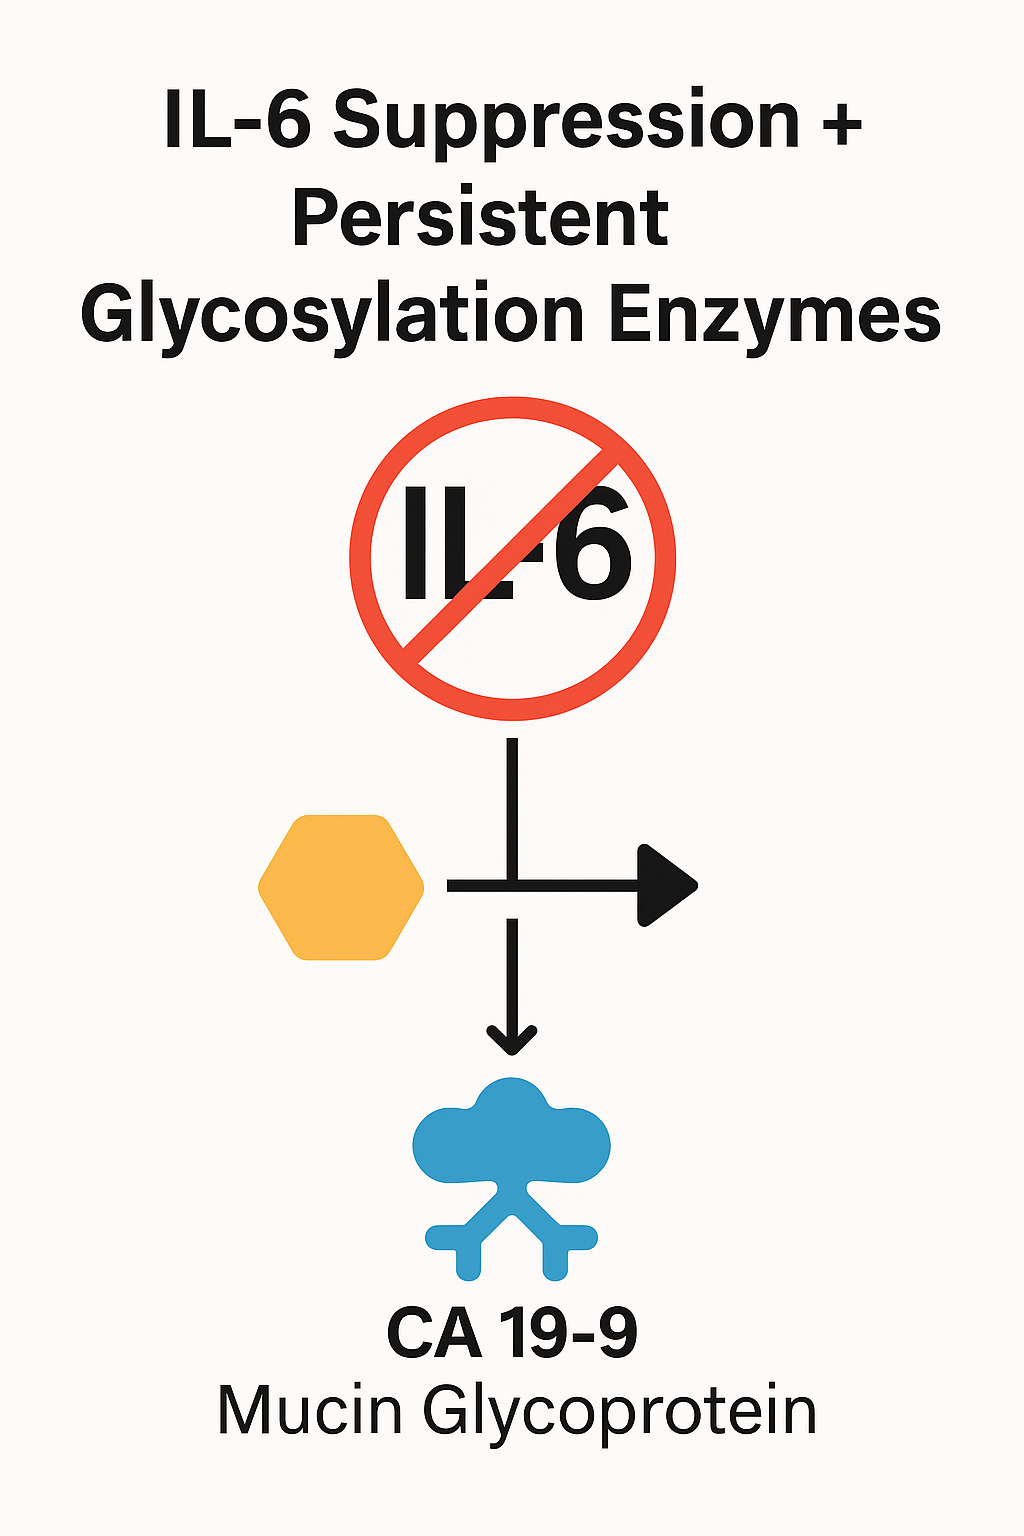 Figure 2: IL‑6 suppression with persistent glycosylation enzymes (FUT3/ST3Gal‑III) yielding continued CA 19‑9 expression on mucins.
Subclonal evolution with a new phenotype
Selective pressures (therapy, microenvironment) can favor KRAS/BRAF/TP53-altered subclones with high mucin glycophenotype but reduced inflammatory signaling, yielding CA 19-9↑ despite IL-6↓ [7]. This can be detected by circulating tumor DNA (ctDNA) profiling and correlated with mucin/glycosylation markers [3, 7]. In everyday practice, a new rise in CA 19-9 after initial response, especially with new lesions, should trigger ctDNA to uncover emergent drivers and guide targeted escalation (Figure 3).
Dogma: Biomarker discordance + new disease = genotype it. Order ctDNA to confirm subclonal shift and align therapy with the dominant clone [7, 9] (Figure 4).
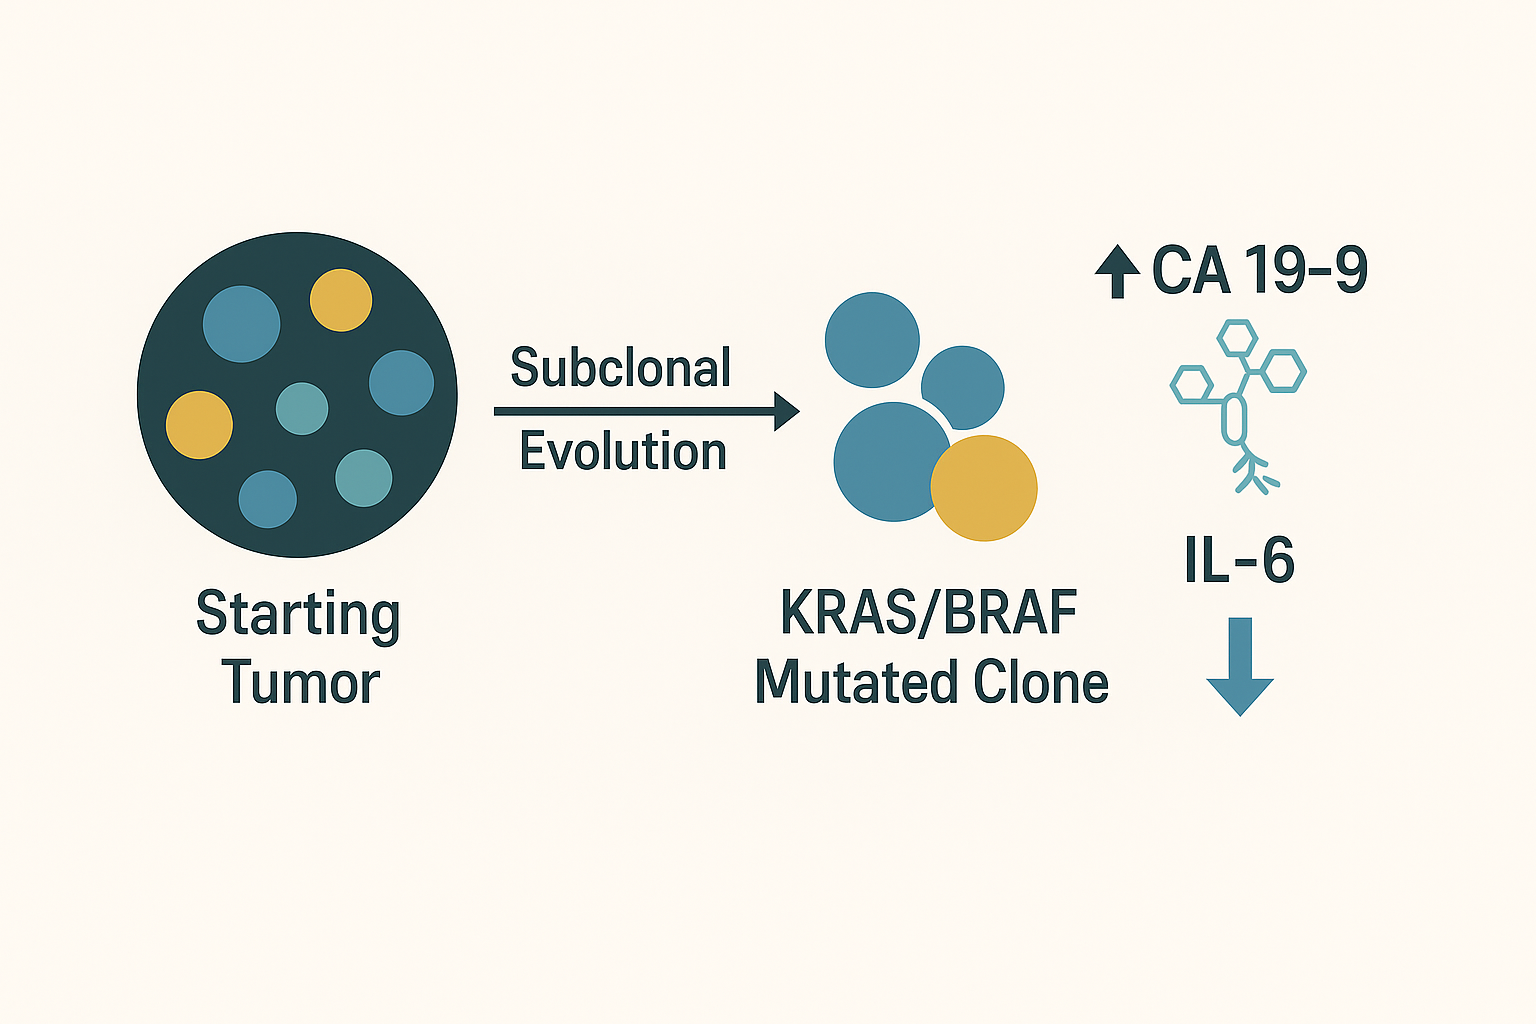 Figure 3: Subclonal evolution schematic: starting tumor → emergent KRAS/BRAF‑mutant clones → CA 19‑9↑ with IL‑6↓.
Extragastrointestinal sources or biliary contribution
CA 19-9 is produced by biliary epithelium; cholestasis, cholangitis, stones, or benign strictures may elevate it. Liver enzymes (ALP/GGT), ultrasound, or MRCP help rule in/out these causes [8]. Importantly, CA 19-9 often falls after relieving obstruction, distinguishing biliary contribution from tumor-derived secretion [8].
Dogma: Stable imaging + cholestatic labs = treat biliary first. Reassess CA 19-9 after resolution before declaring oncologic progression [8, 9].
 Figure 4: Expanded subclonal evolution timeline highlighting transition from polyclonal tumor to dominant KRAS/BRAF subclone with CA 19‑9 secretion.
Therapy-induced lysis and exosomal shedding
Effective cytotoxic/targeted therapy may reduce inflammatory cytokines yet transiently raise circulating CA 19-9 via tumor lysis and vesicle/exosome release; careful temporal correlation with imaging and ctDNA is needed [4, 9]. Such “surges” typically occur early after therapy initiation or intensification and should be interpreted with trend data.
Dogma: A short-term CA 19-9 spike soon after starting effective therapy is not automatic progression; correlate with falling ctDNA or stabilizing scans before altering treatment [4, 9].
Markers for Stratification
A minimal panel that clarifies CA 19-9↑/IL-6↓ should include:
- ctDNA/cfDNA: detects emergent KRAS/BRAF/TP53 subclones and quantifies molecular response [7, 9]. Use when imaging shows progression or when unexplained biomarker discordance persists.
- MUC1/MUC5AC (IHC or ELISA): defines a mucinous phenotype that carries sLe^a and links to CA 19-9 behavior [2, 3, 10]. High MUC5AC strengthens the inference that a CA 19-9 rise is tumor-driven in mucinous CRC (Figure 2).
- Glycosylation enzymes: FUT3, ST3Gal-III activities as direct surrogates of CA 19-9 biosynthesis [1]. Tissue assays or transcript surrogates, when available, contextualize persistent antigen shedding.
- Hypoxia/angiogenesis indicators: HIF-1α and/or VEGF to support inflammation-independent drive [1, 2].
- Conventional markers: CEA (CRC mainstay) and LDH; discordant CEA stable with CA 19-9↑ may suggest mucinous subclone or biliary cause [3, 4, 9].
Operational tips (markers)
- Prefer paired sampling (CA 19-9, CEA, IL-6, ± ctDNA) at consistent intervals to reduce analytical noise [4, 9].
- In mucinous CRC with high MUC5AC/MUC1, set a lower threshold for investigating CA 19-9 rises because the pretest probability of tumor-derived signal is higher [2, 3, 10].
- A falling ctDNA with a rising CA 19-9 typically favors lysis/exosomal release or biliary interference rather than clonal outgrowth; repeat in 2–4 weeks with imaging correlation [4, 8, 9].
Practical Workup Algorithm
Step 1: Trigger – Confirmed CA 19-9 rise with normalizing/low IL-6. Repeat to verify trajectory; review assay platform, hemolysis, and intercurrent infection.
Step 2: Imaging – CT/MRI to assess for new lesions [9]. Imaging is the pivot that separates oncologic from non-oncologic pathways (Figure 5).
Step 3: If progression present – Obtain ctDNA (KRAS/BRAF/TP53 ± others); if subclone positive and clinically appropriate, escalate targeted/systemic therapy per guidelines [7, 9]. Document mucin phenotype (MUC1/MUC5AC) to explain CA 19-9 behavior and to support patient counseling [2, 3, 10].
Step 4: If no radiologic progression – Evaluate the biliary tract (bilirubin, ALP/GGT, ultrasound ± MRCP) and treat obstruction/inflammation when present [8, 9]. Re-measure CA 19-9 after biliary intervention; a drop supports non-tumor contribution [8].
Step 5: Ancillaries – Consider MUC1/MUC5AC, FUT3/ST3Gal-III, and hypoxia markers to document non-inflammatory mucin/glycan drive [1–3]. Use these to avoid premature escalation and to explain IL-6/CA 19-9 decoupling during patient discussions.
Step 6: Monitoring – Repeat CA 19-9, CEA, IL-6, and reassess with imaging/ctDNA at clinically defined intervals [4, 9]. Trend-based decisions outperform single-time point judgments, particularly during early treatment cycles (Figure 6).
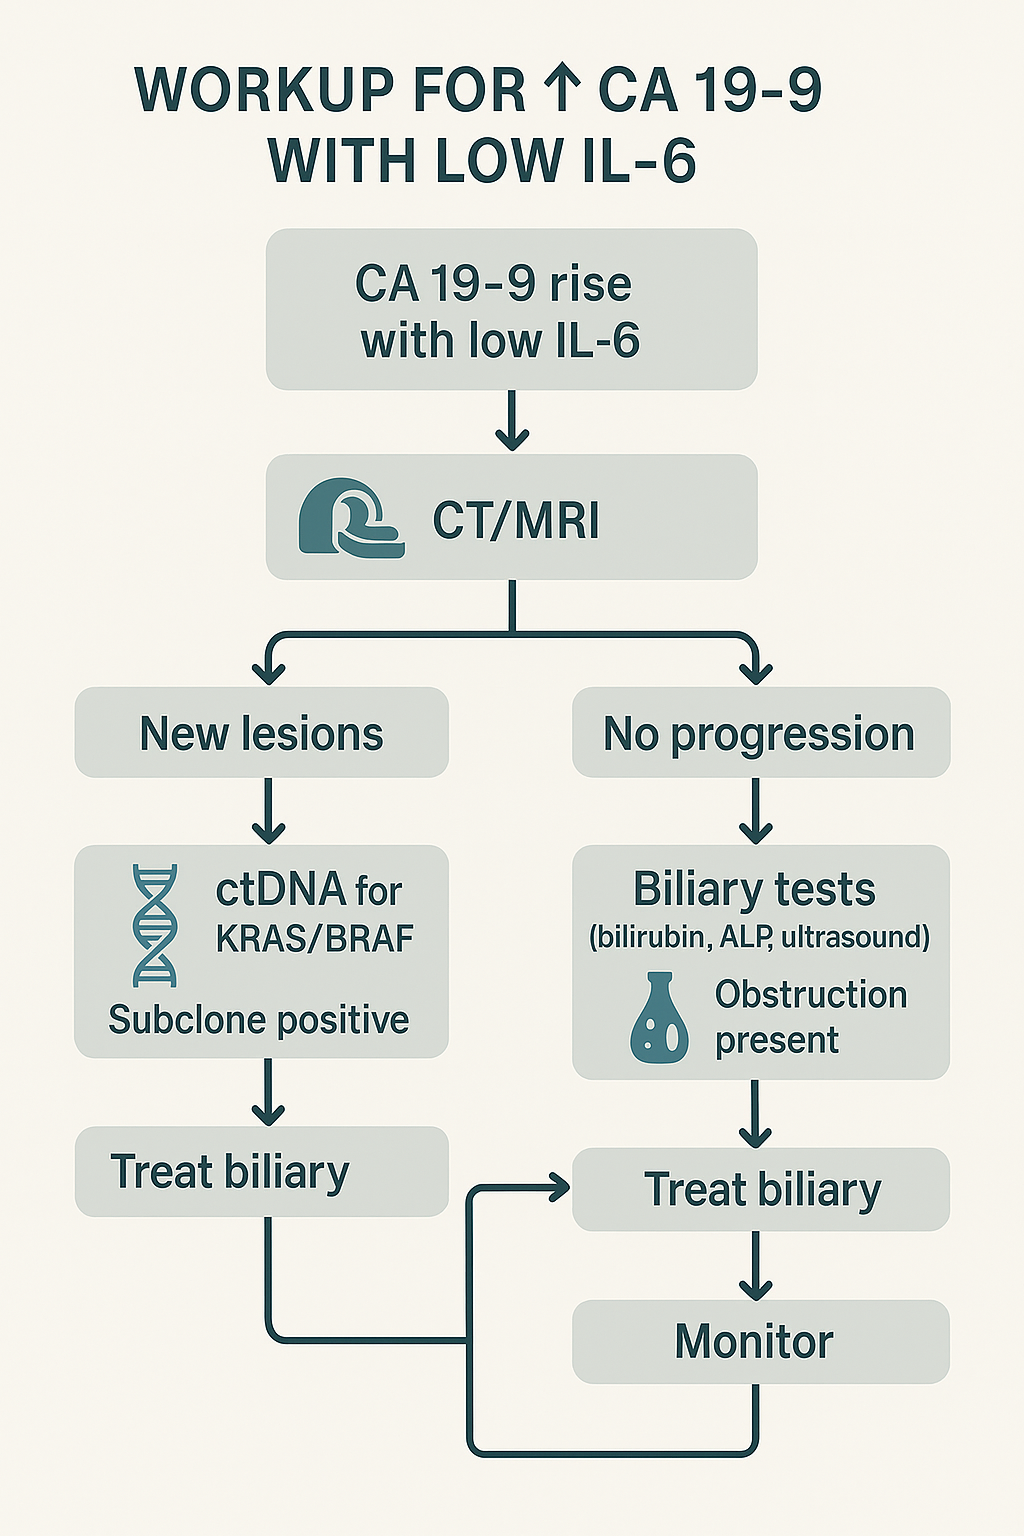 Figure 5: Workup flowchart for CA 19‑9 elevation with low IL‑6 (CT/MRI; ctDNA when progression; biliary tests when stable; treat accordingly; monitor).
Common pitfalls and how to avoid them
- Pitfall: Escalating therapy on CA 19-9 alone. Avoidance: Require imaging or ctDNA corroboration [7, 9].
- Pitfall: Ignoring the biliary tree when scans are stable. Avoidance: Always check ALP/GGT and consider ultrasound/MRCP [8].
- Pitfall: Misreading post-treatment spikes. Avoidance: Reassess in 2–4 weeks with ctDNA/imaging context; look for downtrending ctDNA [4, 9].
Pitfall: Overlooking mucin biology. Avoidance: Confirm MUC1/MUC5AC in mucinous CRC; expect greater CA 19-9 volatility [2, 3, 10].
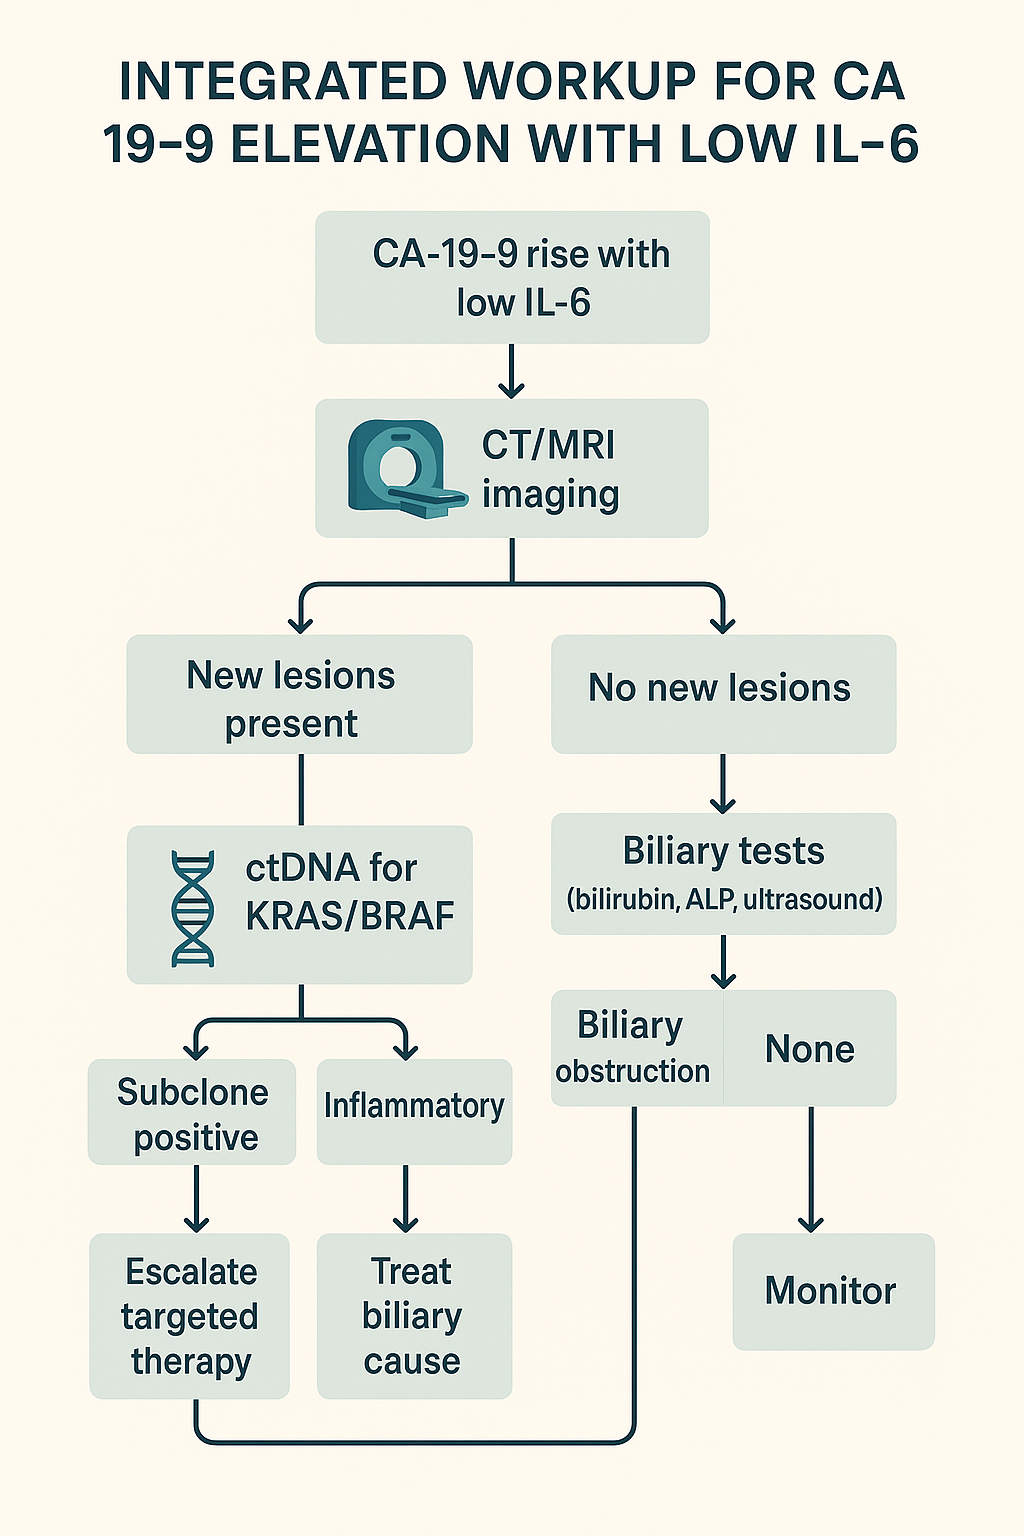 Figure 6: Integrated workup variant with branches for inflammatory vs. biliary vs. subclone‑positive outcomes and suggested actions.
Discussion
Interpreting an isolated CA 19-9 rise requires acknowledging that (i) mucin glycosylation can persist under IL-6 suppression [1, 2, 5, 6]; (ii) hypoxia/VEGF programs can substitute as upstream drivers [1, 2]; (iii) subclonal evolution can reweight tumor output toward mucinous glycotopes [7, 10]; and (iv) biliary or treatment related processes can elevate serum CA 19-9 without representing tumor growth [8, 9]. Our framework emphasizes cross-validation, radiology, ctDNA, biliary labs, and mucin/glycosylation profiling, rather than acting on CA 19-9 alone. In practice, a patient with CA 19-9↑ and IL-6↓ who has stable imaging but cholestatic labs should undergo biliary management first; conversely, new lesions plus ctDNA-defined subclone support therapy escalation, even if IL-6 remains low [7–9].
What a CA 19-9↑/IL-6↓ pattern actually means
Pathobiology: CA 19-9 is not a tumor-specific protein but the sLe^a glycan displayed on mucins. Once the fucosylation/sialylation axis (FUT3, ST3Gal-III) is engaged, biosynthesis can continue even as inflammatory drivers fall, explaining persistent antigen shedding during IL-6 suppression [1, 2, 5, 6]. Alternative control loops, hypoxia/HIF-1α → VEGF, promote mucin transcription and glycan elaboration independent of systemic cytokines [1, 2]. Evolutionary rewiring under therapy selects KRAS/BRAF/TP53-altered subclones with mucin high, cytokine low phenotypes that raise CA 19-9 without an IL-6 signal [7, 10]. Finally, the biliary epithelium contributes to CA 19-9; cholestasis/inflammation or instrumentation can elevate levels without tumor growth [8].
Clinical translation: Treat CA 19-9 as a context-sensitive signal rather than a standalone surrogate of volume. Discordance with IL-6 is a prompt to ask which of the four mechanisms dominates – persistent glycosylation [1, 2, 5, 6], hypoxia/angiogenesis [1, 2], clonal evolution [7, 10], or biliary confounding [8, 9].
Decision heuristics for busy clinics
H1: Confirm and pair – Recheck CA 19-9 within 2–4 weeks on the same assay and pair it with IL-6, CEA, and basic liver panel; trends beat single values [4, 9].
H2: Anchor to imaging – New/enlarging lesions trump biomarkers for defining progression; if scans are stable, prioritize biliary and treatment effect explanations [8, 9].
H3: Genotype the discordance – When CA 19-9 rises with low IL-6 and radiology suggests progression, order ctDNA; a positive clonal signal validates escalation even if cytokines remain quiet [7–9].
H4: Respect the biliary tree – Elevated ALP/GGT or ultrasound/MRCP abnormalities shift pre-test probability strongly toward a non-tumor source; treat and re-measure before changing oncology care [8].
H5: Beware early “lysis spikes” – A short-term CA 19-9 bump after starting an effective regimen, especially with falling ctDNA, usually represents cell death/exosomal release; do not reflexively switch therapy [4, 9].
A practical matrix (how to act on common patterns)
| Pattern | Likely biology | Immediate action |
CA 19-9↑, IL-6↓,
imaging stable,
cholestatic labs | Biliary contribution [8] | Manage obstruction/cholangitis → re-test CA 19-9 after resolution |
CA 19-9↑, IL-6↓,
new/enlarging lesions | Subclonal progression [7, 10] | Order ctDNA; if driver detected, escalate per guidelines; document mucin phenotype [7–9] |
CA 19-9↑ shortly after
therapy, ctDNA↓,
imaging improving | Lysis/exosomal surge [4, 9] | Continue regimen; repeat markers in 2–4 weeks |
CA 19-9 persistently↑,
IL-6 persistently↓,
imaging equivocal | Hypoxia/angiogenesis or
persistent glycosylation [1, 2, 5, 6] | Consider HIF-1α/VEGF context, MUC1/MUC5AC, ± targeted imaging; close-interval follow-up |
Subspecialty pearls
Medical oncology: In mucinous CRC, anticipate greater CA 19-9 volatility; incorporate MUC1/MUC5AC into the problem list to normalize expectations and prevent overreaction to modest rises [2, 3, 10]. During maintenance therapy, a rising CA 19-9 with flat CEA is classic for a mucin-dominant subclone or biliary confounding; avoid premature escalation without ctDNA/imaging support [3, 4, 8, 9].
GI/hepatobiliary: When tumor markers misbehave, a low-threshold biliary screen (ALP/GGT, ultrasound; escalate to MRCP if abnormal) prevents false progression calls [8]. Expect CA 19-9 to decline after decompression or infection control; document the nadir before declaring tumor stability.
Radiology: Report features of hypoxia/angiogenesis (rim enhancement, necrosis, rapid growth) that can explain biomarker decoupling and support anti-angiogenic strategies even with low IL-6 [1, 2, 9].
Molecular pathology: Flag KRAS/BRAF/TP53 shifts on ctDNA and correlate with mucin phenotype; a rising mutant allele fraction plus CA 19-9↑ is a strong composite signal for progression despite quiescent IL-6 [7–9].
Pitfalls and how to avoid them
- Acting on CA 19-9 alone: Marker-only decisions increase overtreatment; require radiology or ctDNA corroboration [4, 9].
- Ignoring timing: Post-treatment spikes are common; always interpret rises relative to cycle start and imaging windows [4].
- Under investigating the biliary tract: Many false alarms are extra oncologic; basic cholestasis labs plus ultrasound avert unnecessary regimen changes [8].
- Misreading stable IL-6 as safety: Hypoxia driven programs can progress “silently”; insist on imaging if symptoms or CA 19-9 trend persist [1, 2, 9].
- Assay variability: Platform changes can simulate movement; keep the same lab whenever possible [4].
Implementation checklist (clinic ready)
- At trigger (CA 19-9↑ with IL-6↓): Repeat markers; review timing therapy; check ALP/GGT/bilirubin; schedule contrast CT/MRI [4, 8, 9].
- If progression on imaging: Order ctDNA (KRAS/BRAF/TP53 ± others); discuss targeted options; document mucin phenotype (MUC1/MUC5AC) [7–10].
- If no progression: Perform biliary workup (ultrasound ± MRCP); treat if obstructed; recheck CA 19-9 two to four weeks after intervention [8, 9].
- If uncertainty remains: Consider hypoxia/angiogenesis context (HIF-1α/VEGF surrogates) and maintain short-interval surveillance [1, 2].
Communication with patients
Set expectations that CA 19-9 is context-dependent. Explain that rises can reflect biliary irritation or treatment response, not just growth. Share the plan: confirm, image, check the bile ducts, and use blood-based genetics (ctDNA) before altering therapy [7–9]. This improves adherence and reduces anxiety.
Quality & audit targets
- Documentation rate that CA 19-9-driven changes were corroborated by imaging or ctDNA (target > 90%) [4, 9].
- Turnaround from discordant signal to biliary evaluation (target ≤14 days) [8].
- Re-sampling compliance within 2–4 weeks after a spike (target > 85%) [4].
Strategic outlook
The CA 19-9↑/IL-6↓ signature often marks a biology shift rather than a lab anomaly: persistent glycosylation [1, 2, 5, 6], hypoxia/VEGF programs [1, 2], subclonal emergence [7, 10], or extra biliary effects [8, 9]. When clinicians enforce cross-validation, radiology, ctDNA, biliary labs, and mucin/glycosylation profiling, CA 19-9 becomes a useful early warning light instead of a trap. The operational message is simple – correlate before you escalate.
Conclusion
CA 19-9↑ with IL-6↓ is not paradoxical; it can signal (a) inflammation-independent mucin/glycan programs, (b) hypoxia-driven tumor biology, (c) subclonal evolution, or (d) non-malignant biliary contributions. A short, structured workup, CT/MRI → ctDNA if progression → biliary evaluation if not → optional mucin/glycosylation/hypoxia assays, improves diagnostic certainty and aligns treatment with the tumor’s prevailing biology [1–10]. Building on that core message, we translate the biochemistry and tumor ecology into concrete, clinic-floor actions.
Biochemical and molecular rationale that justifies the algorithm
- Persistent glycosylation ≠ persistent inflammation: CA 19-9 is the sLe^a glycan borne on mucins (notably MUC1/MUC5AC). Once the fucosylation/sialylation axis (FUT3, ST3Gal-III) is “on,” antigen output may continue even as IL-6/STAT3/NF-κB signaling quiets, explaining CA 19-9↑ with IL-6↓ [1, 2, 5, 6].
- Hypoxia/HIF-1α → VEGF loop: Oxygen stress stabilizes HIF-1α, drives VEGF, and promotes mucin biosynthesis and glycan elaboration independent of systemic cytokines; hypoxia also increases shedding of glycoproteins, maintaining serum CA 19-9 despite low IL-6 [1, 2].
- Clonal ecology shifts: Therapy pressure can favor KRAS/BRAF/TP53-altered subclones that are “mucin high/cytokine low,” decoupling CA 19-9 from IL-6. ctDNA captures these branch points and validates escalation when radiology concurs [7, 10].
- Biliary epithelium matters: Cholestasis, stones, benign strictures, or cholangitis raise CA 19-9 without tumor growth; ALP/GGT and ultrasound/MRCP adjudicate the source [8].
- Treatment-related release: Effective cytotoxic/targeted therapy may transiently spike CA 19-9 via tumor lysis and exosomal shedding; correlate with falling ctDNA and improving imaging before changing course [4, 9].
Actionable practice rules (“correlate before you escalate”)
- Verify and pair (every time): Repeat CA 19-9 on the same platform within 2–4 weeks; pair with IL-6, CEA, bilirubin/ALP/GGT; document timing treatment cycles [4, 9].
- Anchor to imaging: Obtain contrast CT/MRI when the rise is confirmed; imaging defines progression, biomarkers refine probability [9].
- If progression is present: Order ctDNA (KRAS/BRAF/TP53 ± others). A concordant ctDNA rise justifies targeted/systemic escalation even if IL-6 stays low [7–9].
- If imaging is stable: Rule in/out biliary sources, ALP/GGT, ultrasound ± MRCP. Treat obstruction/infection, then re-measure CA 19-9; a drop supports a non-tumor cause [8, 9].
- If uncertainty persists: Profile the mucin/glycosylation/hypoxia axis (MUC1/MUC5AC; ± surrogates of FUT3/ST3Gal-III; HIF-1α/VEGF context) to document an inflammation independent driver and justify watchful surveillance rather than premature escalation [1–3].
- Recognize lysis spikes: An early CA 19-9 bump after starting an effective regimen with falling ctDNA and stable/improving scans → stay the course, recheck in 2–4 weeks [4, 9].
Do/don’t checklist (clinic floor)
- Do confirm trajectory and co-trend IL-6, CEA, and liver/biliary labs at each decision point [4, 8, 9].
- Do treat cholestasis first when cholestatic labs or biliary symptoms accompany a rise [8].
- Do genotype discordance with ctDNA when scans suggest activity; align therapy with the dominant clone [7–9].
- Don’t switch regimens on CA 19-9 alone or on a single measurement, require radiology or ctDNA support [4, 9].
- Don’t assume low IL-6 equals low risk, hypoxia/VEGF programs can progress silently [1, 2].
- Don’t change assay vendors mid-course if avoidable; platform shifts mimic kinetics [4].
Pattern-to-action map (fast triage)
- CA 19-9↑ + IL-6↓ + stable imaging + ALP/GGT↑ → biliary source likely: decompress/treat; re measure; defer oncologic change if CA 19-9 falls [8, 9].
- CA 19-9↑ + IL-6↓ + new/enlarging lesions → subclonal progression probable: ctDNA now; escalate per genotype and guideline context [7–9].
- CA 19-9↑ soon after therapy + ctDNA↓ + scans improving → treatment related release: maintain regimen; recheck in 2–4 weeks [4, 9].
- CA 19-9 persistently↑ + IL-6 persistently↓ + equivocal imaging → document mucin/glycan/hypoxia biology; shorten follow-up interval and avoid premature changes [1–3].
Quality targets and communication
- Audit metrics: (i) ≥90% of therapy changes corroborated by imaging or ctDNA; (ii) biliary evaluation completed ≤14 days when cholestasis suspected; (iii) re sampling compliance ≥85% after spikes [4, 8, 9].
- Patient messaging: Explain that CA 19-9 reflects glycan biology, not just tumor size; rises can come from bile ducts or effective treatment. Share the plan (confirm → image → bile ducts → genetics) to reduce anxiety and improve adherence [1, 2, 8, 9].
Final take
A CA 19-9↑/IL-6↓ signature is a biology signal, not a lab glitch. It points to one of four mechanistic lanes, persistent mucin/glycan programs [1, 2, 5, 6], hypoxia/VEGF driven secretion [1, 2], subclonal evolution captured by ctDNA [7, 10], or biliary confounding [8], each demanding a distinct next step. When clinicians enforce cross validation with radiology, ctDNA, and biliary assessment, and selectively layer mucin/glycosylation/hypoxia profiling, CA 19-9 becomes an early warning light that improves timing and accuracy of decisions, minimizes overtreatment, and better aligns therapy with the tumor’s operative biology [1–10]. The operational mantra remains: confirm, contextualize, and correlate, before you escalate.
Author Contributions
All authors contributed to study design, patient management, data interpretation, and manuscript preparation. All authors approved the final manuscript.
Funding
Institute for Personalized Medicine (Tbilisi, Georgia) and Foconsci Chemical Industry, Department of Biotechnology (China). The funders had no role in study design, data collection/analysis, or the decision to publish.
Institutional Review Board Statement
Data Availability Statement
Conflicts of Interest
The authors declare no conflict of interest.
Acknowledgments
We thank colleagues who provided feedback on biomarker panels and clinical algorithms and the creator of the draft figures on mechanistic background and workup.
References
- Pinho SS, Reis CA. Glycosylation in cancer: mechanisms and clinical implications. Nat Rev Cancer. 2015;15:540-55.
- Kufe DW. Mucins in cancer: function, prognosis and therapy. Nat Rev Cancer. 2009;9:874-85.
- Xue X, Zhou D, Zhou C. New insights into the existing image encryption algorithms based on DNA coding. PLoS ONE. 2020;15(10):e0241184.
- Locker GY, Hamilton S, Harris J, et al. ASCO 2006 update of recommendations for the use of tumor markers in gastrointestinal cancer. J Clin Oncol. 2006;24:5313-327.
- Waldner MJ, Foersch S, Neurath MF. Interleukin 6-A key regulator of colorectal cancer development. Int J Biol Sci. 2012;8(9):1248-253.
- Grivennikov SI, Karin M. Dangerous liaisons: STAT3 and NF κB collaboration and crosstalk in cancer. Cytokine Growth Factor Rev. 2010;21:11-19.
- Gerlinger M, Rowan AJ, Horswell S, et al. Intratumor heterogeneity and branched evolution revealed by multiregion sequencing. N Engl J Med. 2012;366(10):883-92.
- Qin F, Zhou Y, Huan L, et al. Comparison of clomiphene and letrozole for superovulation in patients with unexplained infertility undergoing intrauterine insemination: A systematic review and meta-analysis. Medicine (Baltimore). 2020;99(31):e21006.
- Van Cutsem E, Cervantes A, Adam R, et al. ESMO consensus guidelines for the management of patients with metastatic colorectal cancer. Ann Oncol. 2016;27(8):1386-422.
- Krolow GK, Garcia E, Schoor F, et al. Obstructive sleep apnea and severity of nonalcoholic fatty liver disease. Eur J Gastroenterol Hepatol. 2021;33(8):1104-109.
