Abstract
Albuminuria is the most characteristic marker of diabetic nephropathy (DN), which is a diabetic complication associated with DN progression. However, renal functions decreased by about one-third of diabetic patients before the occurrence of albuminuria. We study the role of telomere length (TL) of blood leukocytes, some inflammatory markers in the progression of DN in patients with type 1 diabetes (T1D). Volunteers were selected and distributed into four groups: group 1 included 20 healthy subjects as control, group 2: 20 T1D patients with albumin excretion rate (AER) < 30 mg/gm creatinine, group 3: 15 T1D patients with (300 > AER > 30 mg/gm creatinine), group 4: 15 T1D patients with (AER > 300 mg/gm creatinine) and group 5 (DN group), which is a collective group between group 3 and group 4. Glycated haemoglobin (HbA1c), serum urea, creatinine, malondialdehyde (MDA), 8-OHdG, and TL in leukocytes were measured. Results showed a significant increase in HbA1c, creatinine, urea, 8-OHdG, transforming growth factor β1 (TGF-β1), MDA and decrease in TL in G2, G3, G4, and G5 compared with control with a p-value < 0.05.
Keywords
diabetic nephropathy, 8-OHdG, telomere length, type 1 diabetes, malondialdehyde, transforming growth factor β1, 7, 8-dihydro-2-deoxyguanosine (8-OHdG)
Abbreviations
DN: diabetic nephropathy; TL: telomere length; T1D: type 1 diabetes; T2D: type 2 diabetes; AER: albumin excretion rate; HbA1c: glycated haemoglobin; MDA: malondialdehyde; TGF-β1: transforming growth factor β1; DM: diabetes mellitus; ROS: reactive oxygen species; DNA: deoxyribonucleic acid; PCR: polymerase chain reaction
Introduction
The morbidity and mortality rates of diabetes mellitus (DM) have risen continually at an alarming rate in recent years, and the population with DM is predicted to be about over four hundred and thirty million worldwide by 2030 [1]. Type 1 diabetes (T1D) is an autoimmune disease in which blood sugar increases due to damage in β islet cells in the pancreas and because of high blood sugar, chemokines, inflammatory cytokines, and reactive oxygen species (ROS) increased, and then diabetic nephropathy (DN) occurred. DN starts with normoalbuminuria, microalbuminuria, macroalbuminuria and ultimately leads to end-stage renal disease (ESRD) [2]. The most important marker of DN until now is albuminuria, which is associated with DN progression, but it is also associated with cardiovascular events and renal functions declines in about one-third of the patients before the occurrence of albuminuria, which makes it inadequate to detect albuminuria alone to monitor the incidence of DN [3, 4]. So, scientists search for other biomarkers that are earlier than microalbuminuria or those appearing at the same time [5].
Telomeres are repetitive nucleotide sequences at each end of a chromosome [6], composed of double strands of deoxyribonucleic acid (DNA), in humans, the sequence of nucleotides in telomeres is TTAGGG, with the complementary DNA strand being AATCCC except for each end, a single-stranded TTAGGG called telomere overhangs [7]. There are many studies that had linked shorter telomeres to health behaviors, such as smoking, aging, and age-related diseases including coronary heart disease, diabetes, and cancer [8]. In addition, previous findings have shown a correlation between telomere length (TL) and depression, stress, schizophrenia, drug abuse, and Alzheimer’s disease [9].
Short TL increases the risk of diabetes. The normoglycemic population with shorter TL had a high risk of developing diabetes [10]. Hyperglycemia, which increases oxidative stress, accelerates the TL shortening especially in islet β cells, causing β cell dysfunction and reduced insulin secretion [11]. The telomere is not only a predictor of diabetes; by regulating oxidative stress and β cell apoptosis, it also takes an important part in the mechanism of diabetes.
Recent researches focus on studying the role of ROS, hypoxia, and glomerular endothelial injury in the progression of DN [12]. ROS interact with DNA and causes damage, this damage includes single- and double-stranded DNA breaks, deletions, and modifications of the nucleoside. Guanine is more susceptible to oxidation by ROS. 8-OHdG produced by oxidation of hydroxyl radical (OH•) to carbon in position 8 in amino acid guanine. 8-OHdG reflects general cellular oxidative stress, so it may consider a marker of DNA damage in diabetic patients [13].
Subjects and Methodology
This study included 70 human volunteers, they were classified as follows according to albumin excretion rate (AER) and C-peptide; group 1: control group included 20 healthy subjects, group 2 included 20 patients with normoalbuminuria (AER < 30 mg/gm), group 3 included 15 patients with microalbuminuria (300 mg/gm > AER > 30 mg/24h), group 4 included 15 patients with macroalbuminuria (AER ≥300 mg/gm) and group 5 (DN group), which is a collective group between group 3 and group 4. The mean age of all volunteers was (25 ± 5) years old. All patients were selected from the outpatient clinics in the National Institute for Diabetes and Endocrinology (NIDE), Cairo, Egypt, and Shebein El-Kom Teaching Hospital, Menofia, Egypt. The diabetic patients were treated with insulin with a dose adjusted according to the state of each patient. A detailed clinical history had been obtained after biochemical investigation to exclude any disease other than T1D according to C-peptide results (Figure 1). The purpose and nature of the study were explained to all subjects and written voluntary consents were obtained before their participation. Approval was taken from the research committee of the General Organization of Teaching Hospitals and Institutions (GOTHI) with the number (HSH00025).
Blood samples were collected, centrifuged at 3000 rpm for 10 min at 4°C, serum samples were rapidly separated and stored at -80°C until the measurements of 8-OHdG, TGF -β1, urea, creatinine, C- peptide, and malondialdehyde (MDA) [14]. Another part of the blood was taken on EDTA for the determination of glycated haemoglobin (HbA1c) and extraction of DNA for the determination of TL, these analyses were tested once and DNA elution samples were stored at -80°C until the measurements of TL. Fresh morning urine samples were collected and centrifuged at 1500 rpm for 10 min to remove cells and salts, and then the supernatant was kept at -80°C until the measurement of microalbumin to creatinine concentrations. All samples were thawed once.
Biochemical assays
Albumin in urine was determined using a commercial assay kit (Spectrum Diagnostics, Egypt). The urinary albumin/creatinine (A/C) ratio was calculated by dividing the total urine albumin concentration (mg/dl) by the urine creatinine concentration (mg/dl).
Urea and creatinine levels were determined according to the method of Patton et al. [15] using Spectrum Diagnostics Kits, Egypt. MDA level, as a marker of lipid peroxidation, was determined according to the method of Satoh [16] using Biodiagnostic Company Kits, Egypt. Transforming growth factor β1 (TGF-β1) was measured using a commercial ELISA Kit (Boster’s Human TGF-β1, Immunogen Sequence). T1D was determined using DRG C-Peptide Kit, Frauenbergstraße, Germany. The measurements of 8-OHdG using Egypt ELISA Kit (Cloud-Clone Corp.), whole blood samples taken on EDTA used for the determination of HbA1c (Ion Exchange Resin Method) using commercial kits of Spectrum Diagnostics, Egypt.
Molecular assay
TL was determined by real-time polymerase chain reaction (PCR). Genomic DNA in leukocytes was extracted from peripheral blood samples using the QIAamp DSP DNA Blood Spin Kit (Qiagen, Hilden, Germany). Purified DNA samples were diluted by AE and quantified using a NanoDrop 1000 spectrophotometer (Thermo Fisher Scientific, Wilmington, DE, USA) with absorbance scans showing an asymmetric peak at 260 nm confirming the high purity of 1.7–1.9. The concentrations of the DNA samples were fixed to 50 ng/5µl using RNase-free water. TL was determined as the relative ratio of telomere repeat copy number to the single-copy number (T/S) using quantitative PCR protocol. Telomere primer sequences were as follows, designed at the Clinilab Company, Egypt.
Tel 1(5 ‘ to 3 ‘) reverse: GGT TTT TGA GGG TGA GGG TGA GGG TGA GGG TGA GGG T.
Tel 2 Sequence (5 ‘ to 3 ‘) forward: TCC CGA CTA TCC CTA TCC CTA TCC CTA TCC CTA TCC CTA.
36 B4u Sequence (5 ‘ to 3 ‘) reverse: CAG CAA GTG GGA AGG TGT AAT CC.
36 B4d Sequence (5 ‘ to 3 ‘) forward: CCC ATT CTA TCA TCA ACG GGT ACAA.
Amplification step had been occurred using Qiagen Quantitect SYBR Green Master Mix, Kit Catalog No. 204143 from Clinilab Company, Egypt, containing HotStarTaq® DNA Polymerase, Quantitect SYBR Green PCR Buffer, contains Tris Cl, KCl, (NH4)2SO4, 5 mM MgCl2, pH 8.7 (20°C), dNTP mix contains dATP, dCTP, dGTP, and dTTP/dUTP of ultrapure quality, SYBR Green I, ROX™ Passive Reference Dye and 5 mM MgCl2). Standard Human Genomic DNA, Promega Corporation, USA, with concentration 209 µg/ml, Lot No. 0000278546 and part G304A were used for standard curves for telomere (T) and 36B (S) primers separately (Table 1).
| Component for telomere reaction | Volume/reaction |
| Quantitect SYBR Green PCR Master Mix | 12.5 µl |
| Primer 1 (0.1 μM) reverse | 1 µl |
| Primer 2 (0.1 μM) forward | 1 µl |
| Template DNA | 5 µl |
| RNase free water | 5.5 µl |
| Total volume | 25 µl |
Table 1: Preparation of master mix for telomere (T) and 36B (S) reactions (2 reactions for each sample).
Programming of Rotor-Gene Q Serial No. ( R0716300), 10 min in 95°C to activate HotStarTaq Plus DNA Polymerase by this heating step, two-step cycling, denaturation and combined annealing/extension about 15 s 95°C for 18 cycles 2 min 54°C, in which fluorescence performed and data collected with 40 cycles for telomere reaction and10 min 95°C, heating step, two-step cycling, denaturation and combined annealing/extension about 30 cycles for 15 s 95°C and 1 minute 58°C, in which fluorescence performed with 40 cycles and data collected for 36B reaction. Reaction tubes were placed in the Rotor-Gene Q-cycler. Serial dilution of the standard has been worked at the same time in the same way and results are imported from this curve (Figure 1 and 2).
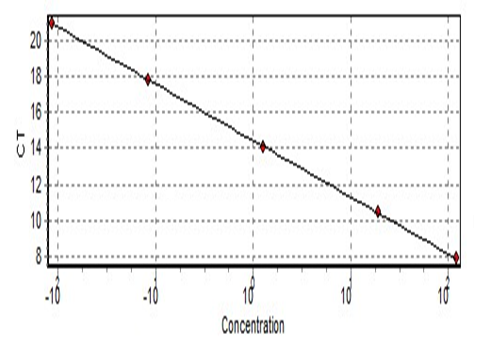
Figure 1: Standard curve of the telomere.
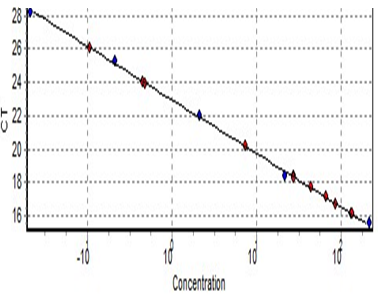
Figure 2: Standard curve of the 36B.
Calculation of the result for absolute TL (ng/reaction) per single-copy gene (T/S). Where T is the amount of total telomere and S is (36B) as it represents the number of double strands.
Statistical analysis of the data
Data was analyzed using IBM SPSS software package version 20.0. (Armonk, NY: IBM Corp). Quantitative data were described using mean and standard deviation. Using t-test (ANOVA) for normally distributed quantitative variables to compare between more than two groups and Post Hoc Test (Tukey) for pairwise comparisons.
Results
The results revealed a highly significant increase in HbA1c in T1D groups (G2, G3, G4, and G5) compared with control (G1) with P-value within groups (0.0005) respectively. Also, a significant increase within DN groups (G3, G4, and G5) in HbA1c compared with the T1 normoalbuminuric group (G2) with a P-value < 0.05. A comparison between DN groups (G3 and G4) showed a significant increase in macroalbuminuria (G4) compared with microalbuminuria (G3) with P-value < 0.05 (Table 2). No significant difference in age, they are male with nearly the same age.
| Variable | Age (years) | AER mg/gm creatinine | HbA1c % | C-peptide ng/ml | Sex |
| G1 (Mean ± SD) N = 20 | 25 ± 10 | 4.85 ± 2.2 | 4.83 ± 0.28 | 3.14 ± 0.68 | Male |
| G2*” (Mean ± SD) N = 20 | 25 ± 5 = 10 | 17 ± 4.59 | 6.04 ± 0.299 | 0.03 ± 0.018 | Male |
| G3*#” (Mean ± SD) N = 15 | 25 ± 10 | 68.6 ± 17.8 | 7.44 ± 0.75 | 0.038 ± 0.025 | Male |
| G4*#” (Mean ± SD) N = 15 | 25 ± 10 | 328.9 ± 24.25 | 8.18 ± 0.291 | 0.045 ± 0.03 | Male |
| G5*#” (Mean ± SD) N = 30 | 25 ± 10 | 201.9 ± 151.17 | 7.58 ± 0.89 | 0.044 ± 0.031 | Male |
| P-value | NS | < 0.005 | < 0.005 | < 0.005 | NS |
Table 2: Results of age, AER, C-peptide, and HbA1c. *Comparison of groups with control (Group 1), #Comparison of groups with normoalbuminuria (Group 2), “Comparison between diabetic nephropathy groups (Group 3 and Group 4). P-value < 0.05 is significant.
The results revealed a highly significant increase in kidney functions (urea and creatinine) (Figure 3 and 4) (Table 3) within groups (2, 3, 4, and 5) compared to control with a P-value (0.0008 and 0.001) respectively, a significant decrease in both urea and creatinine in normoalbuminuric diabetic patients (G2) compared with DN groups (G3, G4, and G5) with a P-value < 0.05. Also, results revealed a significant increase in macroalbuminuria compared with microalbuminuria in urea and creatinine with a P-value < 0.05.
| Dependent variable | Groups | N | Mean ± SD |
| Urea (mg/dl) | G1(control) | 20 | 22.4 ± 3.59 |
| G2 (normoalbuminuria) | 20 | 31.5 ± 6.2Ḁ |
| G3 (microalbuminuria) | 15 | 43.7 ± 6.41ḀḈḊ |
| G4 (macroalbuminuria) | 15 | 55.6 ± 3.56ḀḈḊḘ |
| G5 (DN) | 30 | 48.66 ± 11.37ḀḈ |
| Creatinine (mg/dl) | G1(control) | 20 | 0.79 ± 0.17 |
| G2 (normoalbuminuria) | 20 | 1.01 ± 0.12Ḁ |
| G3 (microalbuminuria) | 15 | 1.36 ± 0.126ḀḈḊ |
| G4 (macroalbuminuria) | 15 | 2.81 ± 0.173ḀḈḊḘ |
| G5 (T1D, DN) | 30 | 2.108 ± 0.874ḀḈ |
Table 3: Statistics descriptive of urea and creatinine in all studied groups. ḀComparison of groups against control (Group 1), ḈComparison of groups
against (Group 2), ḊComparison of groups against (Group 5), ḘComparison of groups against (Group 3). P < 0.05 is significant.
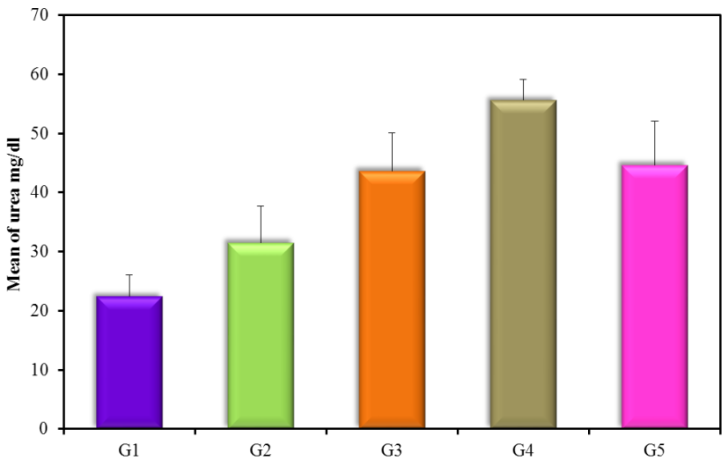
Figure 3: Urea mg/dl (mean ± SD) in groups.
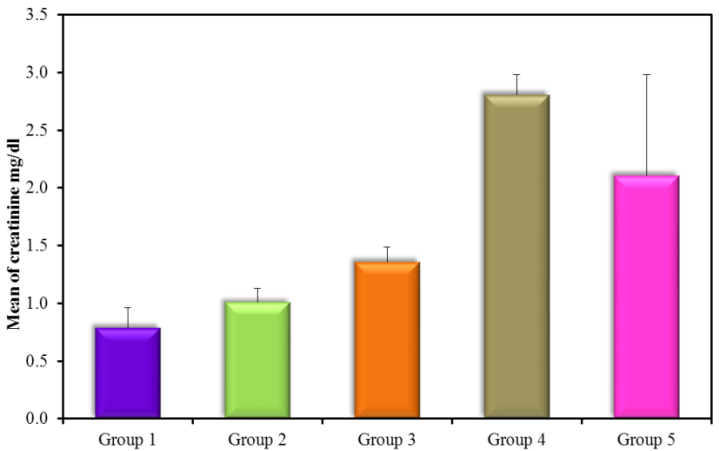
Figure 4: Creatinine mg/dl (mean ± SD) in groups.
The results showed high significance in both TGF-β1 and MDA (Figure 5) (Table 4) within groups with P-value (0.0004, 0.0008) respectively, as it showed a significant increase in all groups compared with control (G1) with P-value < 0.005. Results of TGF-β1 (Figure 6) (Table 4) showed no significance between G2 and G1, but it gives only significance within DN groups (G3, G4, and G5), the non-significant increase between normoalbuminuria (G2) and microalbuminuria (G3). Also, results showed high significance in both TL and 8-OHdG (Figure 7 and 8) (Table 5) within groups with P- value (0.0006, 0.0003) respectively. High significant decrease in TL in all diabetic groups with and without nephropathy (G2, G3, G4, and G5) compared with control P-value < 0.05. No significance between normoalbuminuria (G2) and DN groups (G3, G4, and G5), P-value > 0.05. On the other hand, results of 8-OHdG showed a significant increase in all diabetic groups with and without nephropathy (G2, G3, G4, and G5) compared with control, P-value < 0.05. Also, a significant increase between diabetic groups with and without nephropathy, as there is a significant increase in G4 compared with G3, also with G3 compared with G2, and between G4 compared with G3, P-value < 0.05. Also, negative correlations between AER and TL, 8-OHdG and TL in DN group as indicated (Figure 9 and 10). On the other hand, there is a positive correlation between AER with 8-OHdG in the DN group as shown (Figure 11).
| Variable | Groups | N | Mean ± SD |
| TGF-β1 (pg/ml) | G1(control) | 20 | 35.8 ± 7.83 |
| G2 (normoalbuminuria) | 20 | 68.9 ± 14.38 |
| G3 (microalbuminuria) | 15 | 97.5 ± 14.95ḀḊ |
| G4 (macroalbuminuria) | 15 | 264.1 ± 84.93ḀḈḘ |
| G5 (DN) | 30 | 230.7 ± 133.5ḀḈ |
| MDA (µmol/l) | G1(control) | 20 | 0.991 ± 0.131 |
| G2 (normoalbuminuria) | 20 | 2.109 ± 0.14Ḁ |
| G3 (microalbuminuria) | 15 | 2.477 ± 0.239ḀḈḊ |
| G4 (macroalbuminuria) | 15 | 2.584 ± 0.302ḀḈḊ |
| G5 (DN) | 30 | 2.80 ± 0.324ḀḈ |
Table 4: Statistics descriptive of TGF-β1 and MDA in all studied groups. ḀComparison of groups against control (Group 1), ḈComparison of groups
against (Group 2), ḊComparison of groups against (Group 5), ḘComparison of groups against (Group 3). P < 0.05 is significant.
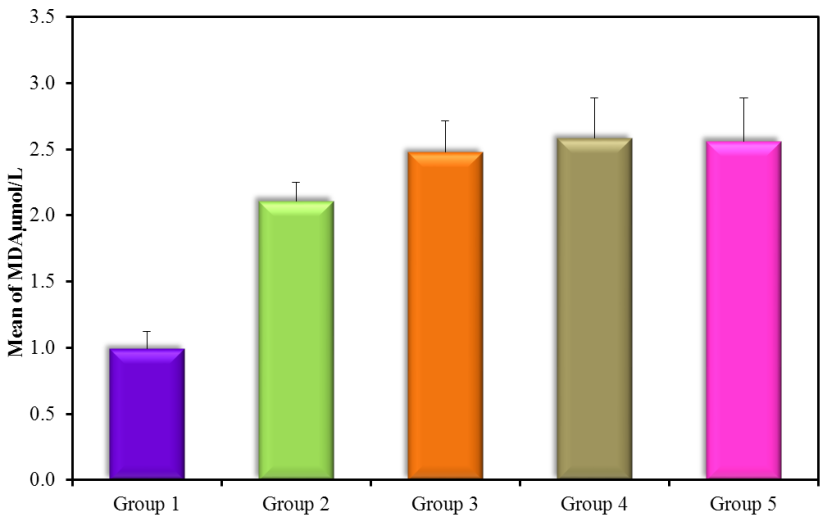
Figure 5: MDA µmol/l (mean ± SD) in groups.
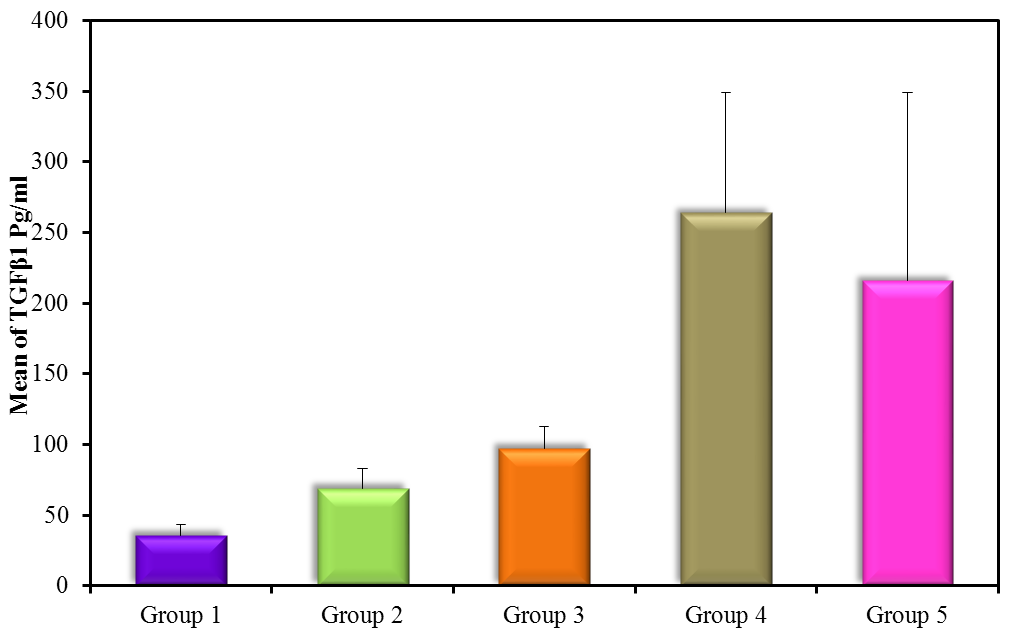
Figure 6: TGF-β1 pg/ml (mean ± SD) in groups.
| Variable | Groups | N | Mean ± SD |
| T/S (ng/reaction) | G1(control) | 20 | 8.82 ± 1.01 |
| G2 (normoalbuminuria) | 20 | 2.3 ± 0.2Ḁ |
| G3 (microalbuminuria) | 15 | 2.22 ± 0.11Ḁ |
| G4 (macroalbuminuria) | 15 | 1.7 ± 0.26Ḁ |
| G5 (DN) | 30 | 1.91 ± 0.44Ḁ |
| 8-OHdG (pg/ml) | G1(control) | 20 | 71.5 ± 6.36 |
| G2 (normoalbuminuria) | 20 | 90.5 ± 1.91Ḁ |
| G3 (microalbuminuria) | 15 | 181.1 ± 3.93ḀḈḊ |
| G4 (macroalbuminuria) | 15 | 282 ± 2.96ḀḈḊḘ |
| G5 (DN) | 30 | 238.79 ± 57.08ḀḈḊ |
Table 5: Statistics descriptive of telomere length per single-copy gene and 8-hydroxydeoxyguanosine in studied groups. ḀComparison of groups
against control (Group 1), ḈComparison of groups against (Group 2), ḊComparison of groups against (Group 5), ḘComparison of groups against
(Group 3). P < 0.05 is significant.
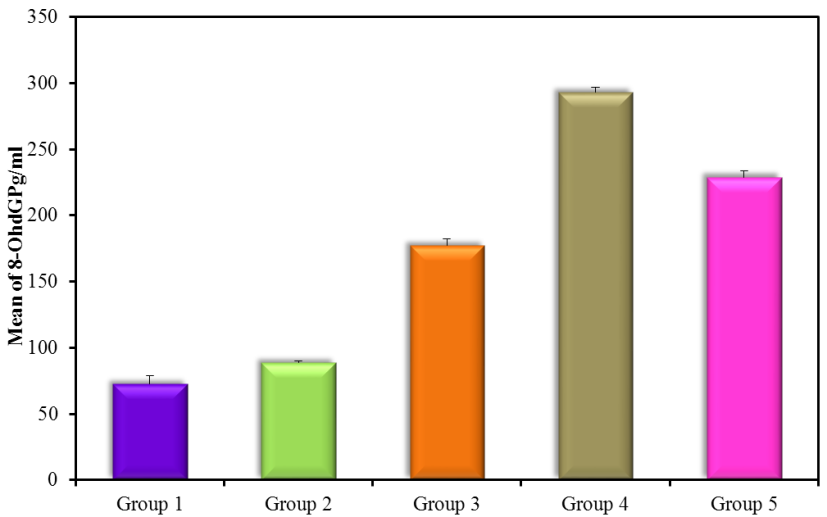
Figure 7: 8-OHdG pg/ml (mean ± SD) in groups.
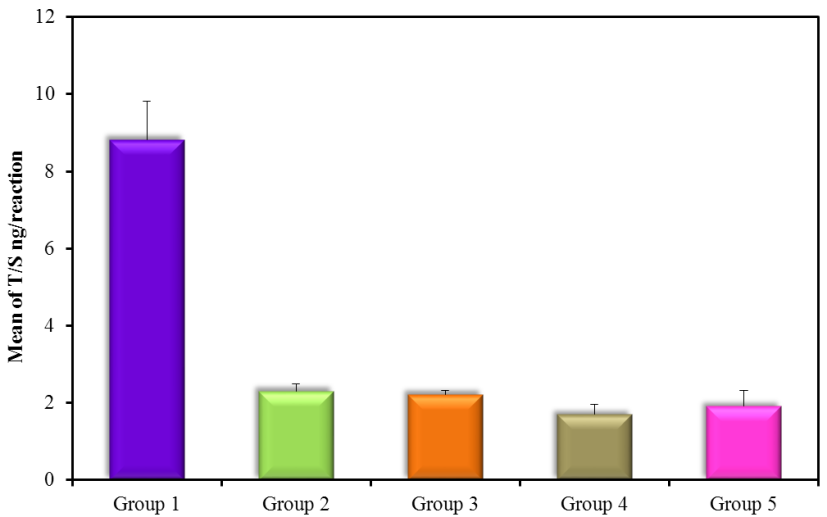
Figure 8: T/S ng/reaction (mean ± SD) in groups.
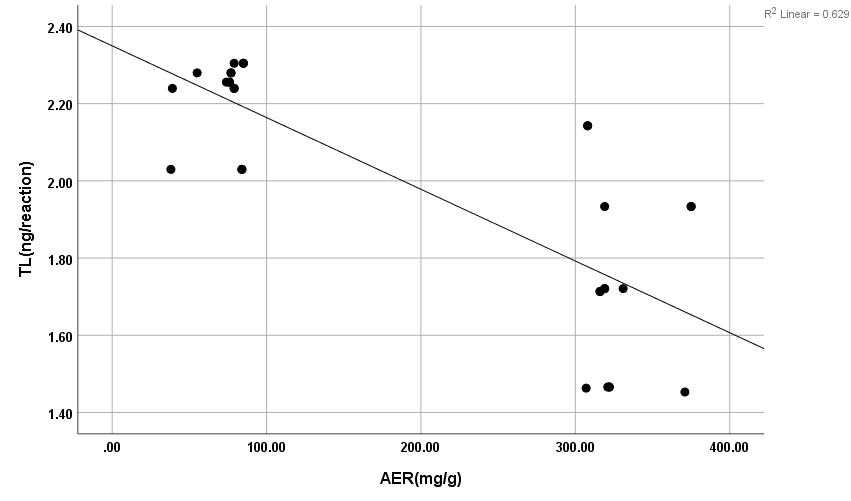
Figure 9: Negative correlation between AER with T/S in DN group. r: Pearson coefficient; *Statistically significant at p ≤0.05.
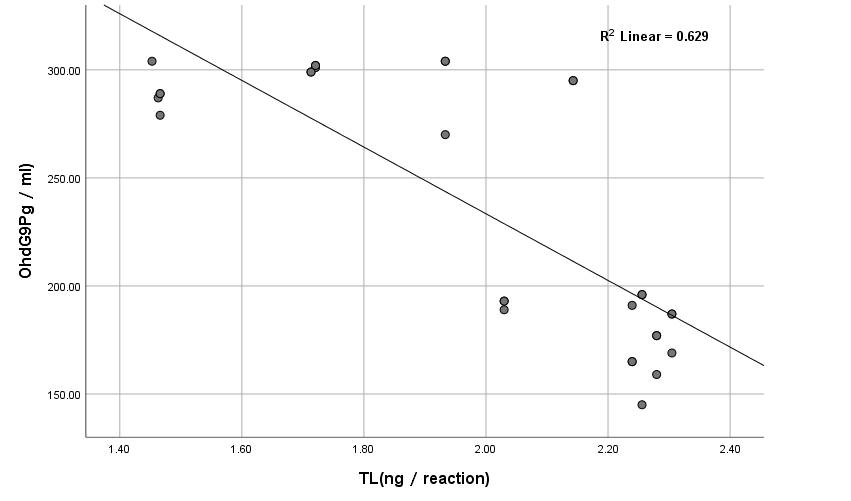
Figure 10: Correlation between 8-OHdG with TL (T/S) in DN group.
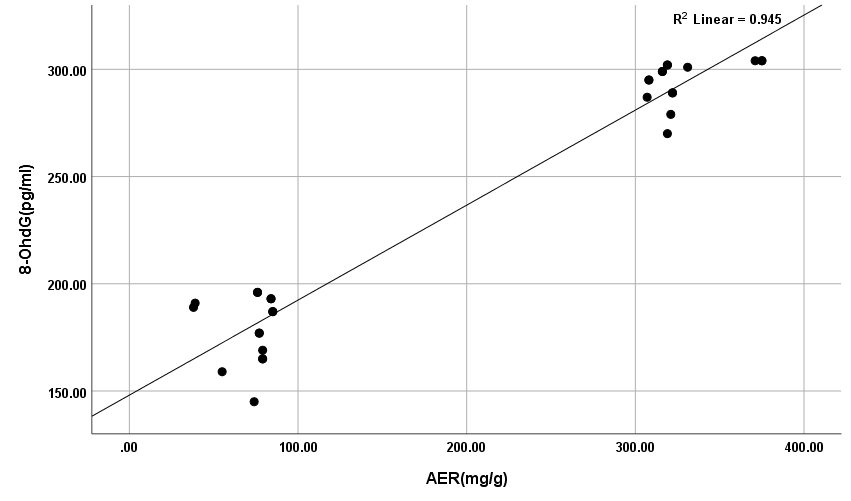
Figure 11: Positive correlation between AER with 8-OHdG in DN group.
Discussion
An increase in fasting blood glucose and HbA1c in all diabetic groups means uncontrolled blood sugar. The results revealed a highly significant increase in kidney functions (urea and creatinine) within groups 2, 3, 4, and 5 compared to control with a P-value 0.0008 and 0.001, respectively. A significant decrease in both urea and creatinine in normoalbuminuric diabetic patients (G2) compared with DN groups (G3, G4, and G5) with a P-value < 0.05. Also, the results revealed a significant increase in macroalbuminuria compared with microalbuminuria in urea and creatinine with a P-value < 0.05, increased urea and creatinine results mean impairment in kidney functions. This is due to nephropathy and these results are in accordance with Gounden et al. [17] and Houot [18] when they were studying renal function tests and reported that increasing urea and creatinine represented impairment in kidney and nephrosis in patients. Also, in accordance with Fujita et al. [19], they noticed that the creatinine clearance rate (Ccr) was slightly reduced in the diabetic mice with nephropathy compared with that without nephropathy. MDA results showed a significant increase in all groups compared with control (G1) with P-value < 0.005. These results are in accordance with Marrocco et al. [20] as they reported an increase in the peroxidation of cellular membrane lipids as well as an increase in the oxidation of proteins that yield protein carbonyl derivatives, producing a high level of MDA, when they were measured and studied the clinical significance of biomarkers of oxidative stress in humans. In addition, the results are in accordance with Zhang et al. [1] as they reported an increase in MDA levels, an important biomarker of lipid peroxidation because of oxidative stress caused by diabetes. The results showed a high significance increase in TGF-β1 in all groups compared with control (G1) with P-value < 0.005. Results of TGF-β1 showed no significance between G2 and G1 but it gives only significance within DN groups (G3, G4, and G5), the non-significant increase between normoalbuminuria (G2) and microalbuminuria (G3).
These results are in accordance with Qiao et al. [21] as they reported that the levels of serum and urinary TGF-β1 are significantly increased in DM and DN. Also, Barutta et al. [22] were in accordance with our results as they reported a significant increase of TGF-β1 levels in glomeruli and tubule-interstitium of T1D and T2D patients when they studied microRNA and microvascular complications of diabetes. Chang et al. [23] are in accordance with our results as their results with tissue-specific TGF-β1 overexpression suggested that suppressing TGF-β1 expression in the proximal tubule was more likely to decrease albuminuria and interstitial fibrosis than to prevent the decrease in renal excretory function. The slightly significant increase in 8-OHdG in patients with normoalbuminuria compared with control indicated that type 1 causes damage (oxidation) to DNA of kidney cells before the occurrence of albuminuria (nephropathy) and after the occurrence of albuminuria this increase in 8-OHdG is highly increased as indicated between macroalbuminuria (G4) compared with microalbuminuria (G3) and presence of highly significant positive correlation between AER and 8-OHdg in study groups (P-value < 0.05). These results are in accordance with Ilse [13] and Qi et al. [24], they showed oxidative damage increase in endothelial cells of glomerulus detected in patients diagnosed with diabetic kidney disease (DKD) as oxidized DNA lesion excretion in the urine (8-OHdG) was significantly increased in patients with DN progression. They disagree with our results as they reported that this increase in 8-OHdG is only DN progression and not with normoalbuminuria but they estimated 8-OHdG in urine and we estimated it in serum so we need more studies on this point and estimate 8-OHdG in both urine and serum samples together and correlate between them and confirm that this significant increase in patients with normoalbuminuria compared with healthy subjects founded in 8-OHdG results in serum, also found in urine or increase only in serum. Sanchez et al. [25] and Bidwe et al. [26] were also in agreement with our data, as higher concentrations of 8-OHdG were found to be associated with an increased risk of progression of kidney disease in both T1DM and T2DM. These results showed a highly significant decrease in TL in all diabetic groups with and without nephropathy (G2, G3, G4, and G5) compared with control P-value < 0.05. No significance between normoalbuminuria (G2) and DN groups (G3, G4, and G5), P-value > 0.05. This is in accordance with Zhou et al. [27] and Navarro-González et al. [28] who suggested that shorter TL was associated with higher HbA1c, FBG, postprandial glucose, and lower glucose-stimulated insulin release when they were studying the effect of diet composition and calories on leucocyte TL. Also, in agreement with Astrup et al. [29] as they found no difference in TL between patients with nephropathy and without nephropathy, but in contrast with Fyhrquist et al. [30] as they reported that TL was similar in healthy control subjects and in patients with T1D and no relation between TL with albuminuria and TL with HbA1c. Also, Tentolouris et al. [31] reported that patients with T2D who have microalbuminuria have short TL and increased arterial stiffness than patients with T2D without microalbuminuria. Correlation between results of 8-OHdG with TL and with AER and between results of TL and AER in each group, we found a significant positive correlation only between 8-OHdG and AER with P-value < 0.001, in DN group (G5), an increase in AER means an increase in 8-OHdG results, also a significant negative correlation between both (8-OHdG, TL) and (AER, TL) with P-value 0.003 in DN group (G5). It means an increase in 8-OHdG and AER corresponds to a decrease in TL. This indicates that TL and 8-OHdG can expect nephropathy prior to AER increase; we can use it as a predictor before the occurrence of DNA damage.
Conclusion
We concluded that hyperglycemia proved by the results of HbA1c is a strong risk factor for DN as it causes an increase in ROS production which has adverse synergic effects in the kidney tissue, causes metabolic changes in the components of the kidney tissue, and then alters renal hemodynamics. This alteration occurred first in TL of the DNA of the cell indicated by the highly significant decrease in TL in all diabetic groups with and without nephropathy (G2, G3, G4, and G5) compared with control P-value < 0.05. We expected from the results of TL that diabetes occurred due to a decrease in TL as it did not affect the significance of HbA1c and albuminuria between groups. After diabetes occurred, ROS begins to affect DNA in another manner which is oxidation, this is indicated in results of 8-OHdG. This damage in DNA occurred first in the cell before the occurrence of albuminuria, this indicated the significant increase of 8- OHdG in normoalbuminuria (G2) compared with control. DNA oxidation reaches a certain limit, the cell begins to defend itself by producing some inflammatory cytokines and growth factors such as TGF-β1. It is a multifunctional cytokine circulating in a biologically inactive form in human plasma. During the progression of DN, there is a significant increase in TGF-β1 barrel to the increase in 8-OHdG until the cell reaches the microalbuminuria stage, DN progression, and the kidney functions begin to decline (increase in urea and creatinine results). At this stage, ROS begins to affect the lipids in the cell membrane and cause lipid peroxidation which is increased till DN progression reaches macroalbuminuria and the decrease in the kidney functions is increased. Finally, TL can predict diabetes but it cannot predict progression in DN. On the other hand, TGF-β1 and 8-OHdG can predict DN prior to albuminuria.
References
- Zhang J, Liu J, Qin X. Advances in early biomarkers of diabetic nephropathy. Rev Assoc Med Bras. 2018;64(1):85-92.
- El-Shazly AA, Sallam AM, El-Hefnawy MH, et al. Epidermal growth factor receptor and podocin predict nephropathy progression in type 2 diabetic patients through interaction with the autophagy influencer ULK-1. J Diabetes Complications. 2019;33(2):128-133.
- Sattarinezhad A, Roozbeh J, Yeganeh BS, et al. Resveratrol reduces albuminuria in diabetic nephropathy: a randomized double-blind placebo-controlled clinical trial. Diabetes Metab. 2019;45(1):53-59.
- Tabaei BP, Al-Kassab AS, Ilag LL, et al. Does microalbuminuria predict diabetic nephropathy? Diabetes Care. 2001;24(9):1560-6.
- Lin Y-C, Chang Y-H, Yang S-Y, et al. Update of pathophysiology and management of diabetic kidney disease. J Formos Med Assoc. 2018;117(8):662-675.
- Sorochynska K, Sych N, Duda A, et al. Dynamics of telomere length and telomerase activity in the human fetal liver at 5-12 weeks of gestation. Stem Cells Int. 2018;2:1385903.
- Vakonaki E, Tsiminikaki K, Plaitis S, et al. Common mental disorders and association with telomere length.Biomed Rep. 2018;8(2):111-116.
- Willeit P, Willeit J, Brandstätter A, et al. Cellular aging reflected by leukocyte telomere length predicts advanced atherosclerosis and cardiovascular disease risk. Arterioscler Thromb Vasc Biol. 2010;30(8):1649‑1656.
- Epel ES. Can childhood adversity affect telomeres of the next generation? Possible mechanisms, implications, and next-generation research. Am J Psychiatry. 2020;177(1):7-9.
- Liu Y, Ma C, Li P, et al. Leukocyte telomere length independently predicts 3-year diabetes risk in a longitudinal study of Chinese population. Oxid Med Cell Longev. 2020;9: 9256107.
- Lee YH, Jung HS, Kwon MJ, et al. Melatonin protects INS-1 pancreatic β-cells from apoptosis and senescence induced by glucotoxicity and glucolipotoxicity. Islets. 2020;12(4)1-12.
- Zhang L, Wen Z, Han L, et al. Research progress on the pathological mechanisms of podocytes in diabetic nephropathy. J Diabetes Res. 2020;8:7504798.
- Ilse SD. Glomerular endothelial cell stress and cross-talk with podocytes in early diabetic kidney disease. Front Med. 2018;23(5):76.
- Toora BD, Rajagopal G. Measurement of creatinine by Jaffe’s reaction–determination of concentration of sodium hydroxide required for maximum color development in standard, urine and protein free filtrate of serum. Indian J Exp Biol. 2002;40(3):352-4.
- Patton CJ, Crouch SR. Spectrophotometric and kinetics investigation of the Berthelot reaction for the determination of ammonia. Anal Chem. 1977;49(3):464-69.
- Satoh K. Serum lipid peroxide in cerebrovascular disorders determined by a new colorimetric method. Clin Chim Acta. 1978;90(1):37-43.
- Gounden V, Bhatt H, Jialal I. Renal function tests. 2018.
- Houot O. Interpretation of clinical laboratory tests. In: Siet G, Henny J, Schielo F, Young DS eds. Biomedical Publication; 1985. p. 220-234.
- Fujita Y, Tominaga T, Abe H, et al. An adjustment in BMP4 function represents a treatment for diabetic nephropathy and podocyte injury. Sci Rep. 2018;8(1):13011.
- Marrocco I, Altieri F, Peluso I. Measurement and clinical significance of biomarkers of oxidative stress in humans. Oxid Med Cell Longev. 2017: 6501046.
- Qiao Y-C, Chen Y-L, Pan Y-H, et al. Changes of transforming growth factor beta 1 in patients with type 2 diabetes and diabetic nephropathy. Medicine (Baltimore). 2017;96(15):e6583.
- Barutta F, Bellini S, Mastrocola R, et al. MicroRNA and microvascular complications of diabetes. Int J Endocrinol. 2018;7:6890501.
- Chang AS, Hathaway CK, Smithies O, et al. Transforming growth factor-β1 and diabetic nephropathy. Am J Physiol Renal Physiol. 2016;310(8): F689-F696.
- Qi H, Casalena G, Shi S, et al. Glomerular endothelial mitochondrial dysfunction is essential and characteristic of diabetic kidney disease susceptibility. Diabetes. 2017;66(3):763-778.
- Sanchez M, Roussel R, Hadjadj S, et al. Plasma concentrations of 8-hydroxy-2′-deoxyguanosine and risk of kidney disease and death in individuals with type 1 diabetes. Diabetologia. 2018;61(4):977-984.
- Bidwe SE, Hisalkar PJ, Shekhar PB, et al. Serum 8-hydroxy deoxyguanine (8-OHdG), DNA damaging oxidative stress biomarker for type 2 diabetes mellitus, the meta analysis. Ind J Basic Applied Med Res. 2018;7(2):17-27.
- Zhou M, Zhu L, Cui X, et al. Influence of diet on leukocyte telomere length, markers of inflammation and oxidative stress in individuals with varied glucose tolerance: a Chinese population study. Nutr J. 2016;15:39.
- Navarro-González JF, Jarque A, Muros M, et al. Tumor necrosis factor-alpha as a therapeutic target for diabetic nephropathy. Cytokine Growth Factor Rev. 2009;20(2):165-73.
- Astrup AS, Tarnow L, Jorsal A, et al. Telomere length predicts all-cause mortality in patients with type 1 diabetes. Diabetologia. 2010;53(1):45-8.
- Fyhrquist F, Tiitu A, Saijonmaa O, et al. Telomere length and progression of diabetic nephropathy in patients with type 1 diabetes. J Intern Med. 2010;267(3):278-86.
- Tentolouris N, Nzietchueng R, Cattan V, et al. White blood cells telomere length is shorter in males with type 2 diabetes and microalbuminuria. Diabetes Care. 2007;30(11):2909-15.
