Abstract
Ametropia, commonly referred to as refractive error, is one of the leading causes of preventable visual impairment worldwide and remains a significant public health concern among school-aged children. This study investigated the effect of ametropia on the academic performance of secondary school students in Owerri Municipal Local Government Area (LGA), Imo State, Nigeria. A descriptive cross-sectional study design was adopted, involving 350 students aged 10–18 years who were randomly selected using a stratified sampling technique from two secondary schools within the municipality. Visual acuity assessment was conducted using the Snellen chart, pinhole test, and occlusion method, while academic performance data were obtained from official school records. Findings revealed that 75.71% of the students had normal visual acuity, whereas 24.29% presented with reduced visual acuity attributable to ametropia. Statistical analysis demonstrated a significant association between visual acuity status and academic performance (p < 0.05). Students with normal visual acuity performed significantly better academically compared to their counterparts with reduced visual acuity. These findings underscore the negative impact of uncorrected ametropia on educational achievement among secondary school children. The study highlights the importance of early detection, routine school vision screening programs, and prompt optical correction to prevent avoidable academic setbacks. Strengthening school-based eye health services within Owerri Municipal LGA and similar settings may contribute significantly to improved educational outcomes and overall child development.
Keywords
ametropia, refractive error, public health, visual impairment, academic
Abbreviations
LGA: Local Government Area
Introduction
Vision plays a fundamental role in learning, as a substantial proportion of classroom activities depend on visual tasks such as reading, writing, and viewing instructional materials. Ametropia, also known as refractive error, refers to an optical condition in which parallel rays of light fail to focus precisely on the retina when accommodation is at rest, resulting in blurred vision. The major forms of ametropia include myopia (short-sightedness), hyperopia (long-sightedness), and astigmatism. When left uncorrected, these conditions can significantly impair visual function and reduce a child’s ability to perform optimally in school [1].
Globally, uncorrected refractive error is recognized as one of the leading causes of visual impairment. The World Health Organization estimates that millions of people worldwide suffer from visual impairment due to uncorrected refractive errors, many of which are preventable through simple interventions such as spectacles. Despite the availability of effective and relatively inexpensive corrective measures, refractive errors continue to account for a large proportion of mild to moderate visual impairment across both low- and high-income countries [2].
Among children, the burden of uncorrected ametropia is particularly concerning. School-aged children rely heavily on clear vision for academic tasks, including reading from the chalkboard, engaging with textbooks, and participating in classroom activities. Reduced visual acuity may lead to difficulty in reading distant objects, copying notes accurately, sustaining attention, and maintaining motivation. Over time, these challenges can translate into poor academic performance, low self-esteem, and reduced educational attainment [3].
The prevalence and distribution of refractive errors vary widely across different populations due to genetic, environmental, and lifestyle factors. Studies conducted in various countries have reported differing prevalence rates among children, with myopia often identified as the predominant refractive error. In Nigeria, research has shown that refractive errors constitute a significant proportion of visual impairment cases. However, data focusing specifically on secondary school children within Owerri Municipal Local Government Area (LGA) remains limited [4].
From a physiological perspective, normal vision (emmetropia) occurs when incident parallel rays of light converge precisely on the retina with accommodation relaxed. In contrast, ametropia occurs when the focal point is displaced either in front of the retina (myopia) or behind it (hyperopia), or when unequal refractive power in different meridians leads to astigmatism. These refractive anomalies may arise due to variations in axial length of the eyeball, curvature of the cornea, or curvature and refractive index of the crystalline lens [5].
Myopia results primarily from elongation of the eyeball or excessive refractive power of the cornea or lens, causing distant objects to appear blurred. Hyperopia, on the other hand, occurs when the eyeball is relatively short or when refractive power is insufficient, leading to difficulty focusing on near objects. Astigmatism arises from irregular curvature of the cornea or lens, producing distorted or blurred vision at all distances. Although these conditions can be effectively corrected with appropriate lenses, many school children remain undiagnosed or under-corrected, especially in resource-limited settings [6].
Visual impairment during childhood not only affects academic performance but may also influence social interaction, cognitive development, and participation in extracurricular activities. Children with reduced vision may experience headaches, eyestrain, squinting, and fatigue, which further compromise concentration and classroom engagement. Early childhood is a critical period for visual development, and prolonged visual deprivation can result in long-term deficits if not promptly addressed [7].
Given the central role of vision in learning, investigating the relationship between ametropia and school performance is essential for informing public health and educational policies. Secondary school students in Owerri Municipal LGA represent a critical population group, as academic achievement during adolescence significantly influences future educational and career opportunities. Understanding the extent to which ametropia affects academic outcomes in this setting is therefore of both clinical and socio-economic importance [8].
This study was undertaken to evaluate the effect of ametropia on the academic performance of secondary school children in Owerri Municipal LGA. By assessing visual acuity and correlating it with academic records, the research aims to provide evidence-based data that can support the implementation of routine school vision screening programs and timely optical correction services within the municipality and beyond.
Materials and Methods
2.1 Study design
This study adopted a descriptive cross-sectional research design to evaluate the effect of ametropia on the academic performance of secondary school students. The design enabled the assessment of visual acuity status and academic records at a single point in time, thereby determining the relationship between refractive error and school performance among the participants.
2.2 Study area
The study was conducted in Owerri Municipal LGA, located in Imo State, Nigeria. Owerri Municipal serves as the administrative headquarters of the state and covers a land area of approximately 58 km², with a population of 127,213 according to the 2006 national census.
Owerri city lies at the intersection of major roads connecting Port Harcourt, Onitsha, Aba, Orlu, Okigwe, and Umuahia, making it a significant commercial and administrative hub in southeastern Nigeria. The area is known for trade in agricultural produce such as palm products, maize, yams, and cassava. The prominent Eke Ukwu Owere market serves as the main commercial center within the municipality.
The urban setting and concentration of educational institutions within the LGA make it suitable for investigating visual health and academic performance among secondary school students.
2.3 Study population
The study population comprised secondary school students within Owerri Municipal LGA. A total of 1,686 students from two selected public secondary schools formed the sampling frame:
Owerri Girls Secondary School – 486 students
Government Secondary School – 1,200 students
The target population included male and female students aged 10–18 years enrolled in Junior Secondary School (JSS1–JSS3) and Senior Secondary School (SS1–SS3).
2.4 Ethical considerations
Ethical clearance was obtained from the Head of the Department of Optometry, Imo State University, Owerri. Approval was also secured from the authorities of the participating schools. Participation was voluntary, confidentiality was maintained, and data were used strictly for academic purposes.
2.5 Sampling technique
A proportionate stratified random sampling technique was employed. Each class level (JSS1, JSS2, JSS3, SS1, SS2, and SS3) constituted a stratum. The number of participants selected from each stratum was proportionate to the class population. Within each stratum, students were selected using simple random sampling to ensure equal representation and minimize selection bias.
2.6 Instruments for data collection
The following instruments were used for data collection:
Snellen chart: Used to assess distance visual acuity at 6 meters.
Pinhole occluder: Used to determine whether reduced visual acuity was likely due to refractive error.
Occluder: Used to cover one eye during monocular visual acuity testing.
Data collection form: A structured form designed to capture participants’ biodata, visual acuity findings for each eye, spectacle usage (if any), and relevant screening results.
2.6.1 Reliability and validity of instruments
The instruments used for visual acuity assessment were standardized ophthalmic tools routinely employed in clinical and field screening settings. Prior to data collection, all instruments were examined to ensure proper alignment, clarity, and functionality. The Snellen chart was positioned at the correct distance and under appropriate lighting conditions to maintain measurement consistency and accuracy.
2.7 Method of data collection
Permission to conduct the study was obtained from the principals of the selected schools after a detailed explanation of the purpose, procedures, and benefits of the research. Informed consent was obtained before screening commenced. Students were also sensitized about the importance of the vision assessment.
Screening was conducted in a school hall under normal daylight illumination. A 6-meter distance was accurately measured and marked. The Snellen chart was placed at one end of the hall, while a chair was positioned at the opposite end, aligned precisely with the 6-meter mark.
Each participant underwent monocular visual acuity testing as follows:
The right eye was tested first while the left eye was occluded gently using an occluder, ensuring no pressure was applied.
Students were instructed not to squint, tilt their heads, or uncover the occluded eye.
Participants were asked to read the letters on the Snellen chart from top to bottom, moving across each line from right to left using a pointer.
If a participant failed to read a line correctly, the line was repeated in reverse order. If the line was missed twice, visual acuity was recorded as the previous correctly read line.
The procedure was repeated for the left eye while the right eye was occluded.
For students with visual acuity less than or equal to 6/9, the pinhole test was performed to determine improvement suggestive of refractive error. For students already using spectacles, visual acuity was tested and recorded with spectacles in place.
Visual acuity was recorded as a fraction, where the numerator represented the testing distance (6 meters) and the denominator represented the smallest line correctly read.
2.8 Inclusion and exclusion criteria
2.8.1 Inclusion criteria
Secondary school students within Owerri Municipal LGA
Students aged 10–18 years
2.8.2 Exclusion criteria
Students younger than 10 years
Students older than 18 years
2.9 Statistical analysis
The data collected were organized and analyzed using descriptive statistical methods. Frequencies and percentages were used to summarize visual acuity status and academic performance. Inferential statistics were applied to determine the association between visual acuity and academic performance, with statistical significance set at p < 0.05.
Results
3.1 Data presentation
The visual acuity of 350 students of two schools, Owerri Girls Secondary School 180 (51.42%) and Government Secondary School (170) (48.7%), was tested.
The table shows the age distribution among the 350 students who were tested. Out of 350 students, 120 were within the ages of 10–13 years, 150 were within the ages of 14–15 years, while 80 were within the ages of 16–18 years (Table 1) (Figure 1).
The table shows the gender distribution among the 350 students who were tested. Out of 350 students, 180 were females, while 170 were males (Table 2) (Figure 2).
The table shows the distribution of ametropia among subjects with respect to age. Among the subjects within the age range 10–13 years, 25 are ametropic, while 95 are not, making a total of 120. Among the subjects within the age range of 14–15 years, 40 are ametropic, while 110 are not, making a total of 150. Among the subjects within the age range 16–18 years, 20 are ametropic while 60 are not, making a total of 80. In total, out of 350 subjects involved in the study, 85 are ametropic while 265 are not (Table 3).
The table shows the distribution of ametropia among subjects with respect to gender. Among the 180 females involved in the study, 40 are ametropic, while 140 are not. Among the 170 males involved in the study, 45 are ametropic, while 125 are not (Table 4).
The table shows the effect of ametropia on school performance of subjects (Table 5).
| Age group | Number of subjects |
| 10–13 | 120 |
| 14–15 | 150 |
| 16–18 | 80 |
| Total | 350 |
Table 1: Age distribution of students.
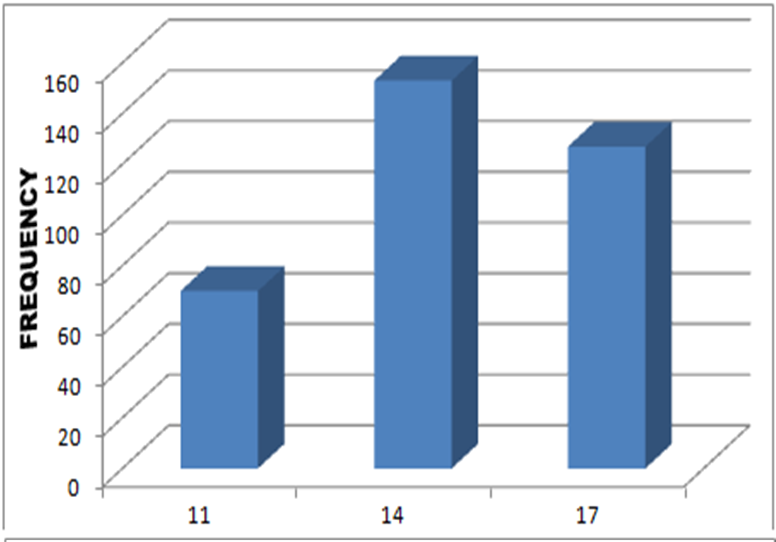
Figure 1: Showing age distribution.
| Gender | Number of subjects |
| Male | 170 |
| Female | 180 |
| Total | 350 |
Table 2: Gender distribution of students.
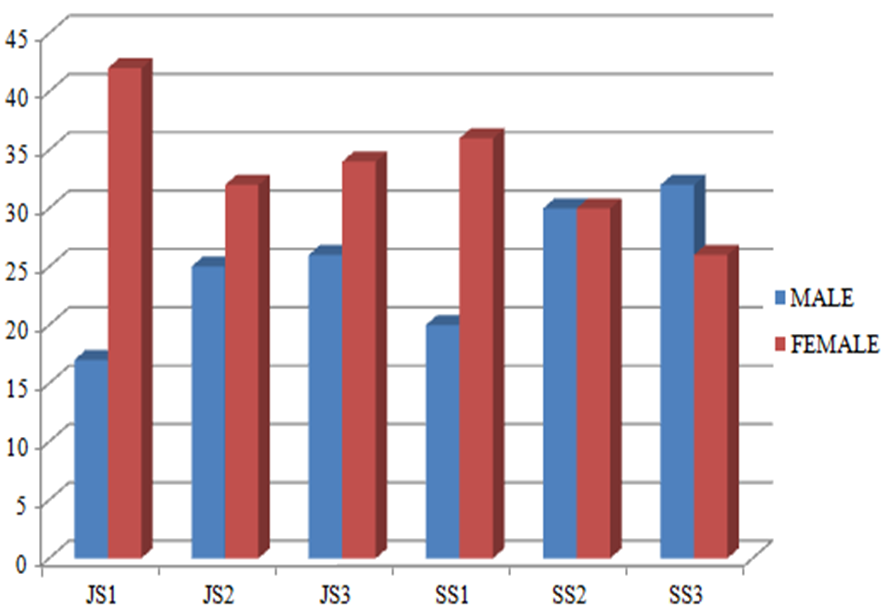
Figure 2: Bar chart showing class-sex distribution of students tested.
| Age group | Number of students with ametropia | Number of students without ametropia | Total students |
| 10–13 | 25 | 95 | 120 |
| 14–15 | 40 | 110 | 150 |
| 16–18 | 20 | 60 | 80 |
| Total | 85 | 265 | 350 |
Table 3: Distribution of ametropia among subjects with respect to age.
| Gender | Number of students with ametropia | Number of students without ametropia | Total students |
| Female | 40 | 140 | 180 |
| Male | 45 | 125 | 170 |
| Total | 85 | 265 | 350 |
Table 4: Distribution of ametropia among subjects with respect to gender.
| Subjects | School performance |
| Subjects with ametropia | 73% poor performance |
| Subjects without ametropia | 27% poor performance |
Table 5: Effect of ametropia on school performance of subjects.
3.2 Testing of hypothesis
Age group 10–13
Observed proportion of ametropia = No. of students with ametropia (25) / Total no. of students in the age group (120)
Observed proportion = 25/120
= 0.2429
Standard error of the difference:
SE = √0.2083 x (1-0.2083) + 0.2429 x (1-0.2429)
___________ _____________
120 120
SE ≈ 0.0521
Z-score:
Z = 0.2083-0.2429
____________
0.0521
Z ≈ -0.6617
p-value: Using a standard normal distribution table or calculator, the p-value associated with a Z-score of -0.6617 is approximately 0.2547.
Age group 14–15
Observed proportion of ametropia = Number of students with ametropia (40) / Total number of students in the age group (150)
Observed proportion = 40/150
≈ 0.2727
Expected proportion of ametropia (under null hypothesis):
Total number of students with ametropia: 85
Total number of students: 350
Expected proportion = 85/350
≈ 0.2429
Standard error of the difference:
SE = √0.2727 x (1-0.2727) + 0.2429 x (1-0.2429)
______________ _____________
150 150
SE ≈ 0.0537
Z-score:
Z = 0.2727-0.2429
___________
0.0537
Z ≈ 0.5557
p-value: Using a standard normal distribution table or calculator, the p-value associated with a Z-score of 0.5557 is approximately 0.2896.
Age group 16–18
Observed proportion of ametropia = Number of students with ametropia (20) / Total number of students in the age group (80)
Observed proportion = 20/80
≈ 0.1667
Expected proportion of ametropia (under null hypothesis):
Total number of students with ametropia: 85
Total number of students: 350
Expected proportion = 85/350
≈ 0.2429
Standard error of the difference:
SE = √0.1667 x (1-0.1667) + 0.2429 x (1-0.2429)
____________ _____________
80 80
SE ≈ 0.0526
Z-score:
Z = 0.2727-0.2429
____________
0.0537
Z ≈ 0.5557
p-value: Using a standard normal distribution table or calculator, the p-value associated with a Z-score of -1.4537 is approximately 0.0734.
Age group 10–13
Calculated p-value: Approximately 0.2547
Significance level (α): 0.05
Since the calculated p-value (0.2547) is greater than the significance level (0.05), we fail to reject the null hypothesis. There is no statistically significant relationship between age (10–13) and the prevalence of ametropia on school performance for this age group.
Age group 14–15
Calculated p-value: Approximately 0.2896
Significance level (α): 0.05
Since the calculated p-value 0.2896 is greater than the significance level (0.05), we fail to reject the null hypothesis. There is no statistically significant relationship between age (14–15) and the prevalence of ametropia on school performance for this age group.
Age group 16–18
Calculated p-value: Approximately 0.0734
Significance level (α): 0.05
Since the calculated p-value 0.0734 is greater than the significance level (0.05), we fail to reject the null hypothesis. There is no statistically significant relationship between age (14–15) and the prevalence of ametropia on school performance for this age group.
Discussion
This study examined the effect of ametropia on the academic performance of secondary school students in Owerri Municipal LGA, Imo State, Nigeria. The findings provide important insight into the relationship between visual health and educational achievement, highlighting a connection that is often underestimated within school health systems [9].
A total of 350 students aged 10–18 years were assessed using standardized visual acuity testing procedures, including the Snellen chart and pinhole occluder. Academic performance data obtained from school records enabled an objective comparison between students with normal visual acuity and those with reduced acuity attributable to ametropia. The structured methodology strengthened the reliability of the findings and allowed for meaningful interpretation [10].
The results demonstrated a significant association between reduced visual acuity and poorer academic performance. Students with normal vision performed better academically than those with uncorrected refractive errors. This finding reinforces the critical role of clear vision in classroom learning. Most instructional activities, such as reading from the board, engaging with textbooks, writing assignments, and participating in visual demonstrations, are visually demanding. When visual input is compromised, comprehension, attention, and classroom participation may be negatively affected, ultimately impacting academic outcomes [11].
One of the important observations from this study is that the impact of ametropia is not exclusively age-dependent. Although statistical significance was not observed in the 10–13-year age group, visual problems were still present among younger students and had noticeable implications for their learning experiences. This challenges the conventional assumption that refractive errors become educationally significant only during later adolescence [12].
Notably, stronger associations between ametropia and academic performance were observed in the older age groups (14–15 and 16–18 years). At these stages, academic demands intensify, and students are expected to engage in sustained reading, detailed note-taking, and examination preparation. Uncorrected visual impairment during this critical educational period may therefore exert a more pronounced effect on performance. These findings suggest that interventions must not only begin early but also evolve in response to increasing academic demands as students advance through school [13].
The study further revealed that gender did not significantly influence the relationship between ametropia and academic performance. Both male and female students exhibited similar patterns of visual acuity impairment and comparable academic challenges associated with reduced vision. This indicates that ametropia constitutes a universal educational risk factor rather than one confined to a particular gender. Consequently, vision screening and corrective interventions should be implemented equitably across all students [14].
The findings underscore that ametropia is not merely a physiological anomaly but an educational barrier with tangible consequences. In settings where routine school-based vision screening is limited, many students may unknowingly struggle with correctable visual impairments. The academic underperformance observed among affected students may therefore reflect unmet visual needs rather than cognitive or motivational deficits [15].
The study highlights the importance of integrating ocular health into the broader educational framework. Early detection through routine screening programs can facilitate timely correction using spectacles or other appropriate interventions. Addressing ametropia at its early stages can help prevent cumulative academic disadvantages and promote equal learning opportunities [16].
Additionally, the findings suggest that school health policies should adopt a developmental perspective. As students progress into higher classes with increasing academic workload, the consequences of uncorrected refractive errors may intensify. Tailored, age-specific interventions could therefore enhance both visual outcomes and academic success [17].
Conclusion
The empirical evidence generated in this study demonstrates a significant relationship between ametropia and academic performance among secondary school students in Owerri Municipal LGA. Ametropia emerges not merely as a clinical condition but as a measurable educational challenge that can hinder student achievement. While the influence of ametropia in the 10–13-year age group did not reach statistical significance, a clear association was observed among students aged 14–15 and 16–18 years. These findings emphasize the progressive educational implications of uncorrected refractive errors as academic demands increase. The study, therefore, calls for the integration of ocular health services within the educational system. Routine school-based screening, early detection, and prompt corrective interventions are essential strategies to mitigate the academic disadvantages associated with ametropia. By bridging clinical care and educational policy, stakeholders can foster an environment that supports both academic excellence and holistic student development. Hence, this research provides a foundation for future studies exploring the specific impact of different types of ametropia and the role of socio-economic factors in shaping visual health and educational outcomes. Collaborative engagement among educators, healthcare professionals, parents, and policymakers remain central to translating these findings into sustainable interventions.
References
- Kim J, Hwang Y, Kang S, et al. Association between Exposure to Smartphones and Ocular Health in Adolescents. Ophthalmic Epidemiol. 2016;23(4):269-76.
- Rahi JS, Peckham CS, Cumberland PM. Visual impairment due to undiagnosed refractive error in working age adults in Britain. Br J Ophthalmol. 2008;92(9):1190-4.
- Williams KM, Bertelsen G, Cumberland P, et al. Increasing Prevalence of Myopia in Europe and the Impact of Education. Ophthalmology. 2015;122(7):1489-97.
- Abah ER, Oladigbolu KK, Samaila E, et al. Ocular disorders in children in Zaria children’s school. Niger J Clin Pract. 2011;14(4):473-6.
- Mayro EL, Hark LA, Shiuey E, et al. Prevalence of uncorrected refractive errors among school-age children in the School District of Philadelphia. J AAPOS. 2018;22(3):214-217.e2.
- Eze UA, Obasuyi OC, Salihu DV, et al. Prevalence and Causes of Blindness and Visual Impairment Among Nigerian Children: A Systematic Review. Clin Ophthalmol. 2024;18:289-301.
- Lim HT, Yu YS, Park SH, et al. The Seoul Metropolitan Preschool Vision Screening Programme: results from South Korea. Br J Ophthalmol. 2004;88(7):929-33.
- Abah, E.R., Oladigbolu, K.K., Samaila, E. et al, A. Ocular disorders in children in Zaria schools. Niger J Ophthalmol. 2018;26(1):23-9.
- Ezegwui IR, Oguego NC, Okoye OI, et al. Prevalence of refractive errors and visual impairment in school children in Enugu South-East Nigeria. Niger J Clin Pract. 2021;24(3):380-6.
- Adeoye AO, Omolase CO. Prevalence and impact of uncorrected refractive errors on school performance in urban and rural Nigeria. Niger J Clin Pract. 2021;24(4):567-73.
- Kawuma M, Mayeku R. A survey of the prevalence of refractive errors among children in lower primary schools in Kampala district. Afr Health Sci. 2002;2(2):69-72.
- Bourne RR, Dineen BP, Huq DM, et al. Correction of refractive error in the adult population of Bangladesh: meeting the unmet need. Invest Ophthalmol Vis Sci. 2004;45(2):410-7.
- Castagno VD, Fassa AG, Vilela MA, et al. Moderate hyperopia prevalence and associated factors among elementary school students. Cien Saude Colet. 2015;20(5):1449-58.
- Askira BH, Akobundu MN. Refractive errors in Maiduguri. BOMJ. 2006;3:7-9
- Gloria CE, Nneli RO, Anyaehie UB, et al. Prevalence, Determinants and Distribution of Refractive Errors in a Nigerian Community. Biosci Biotech Res Asia 2011;8(2).
- Gilmartin B. Myopia: precedents for research in the twenty-first century. Clin Exp Ophthalmol. 2004 Jun;32(3):305-24.
- Montes-Micó R, Ferrer-Blasco T. Distribution of refractive errors in Spain. Doc Ophthalmol. 2000;101(1):25-33.
